

Using polymer tantalum capacitors in Hi-Rel systems requires an assessment of the reliability characteristics of the parts. For this assessment, tantalum capacitors are typically subjected to reliability testing at temperatures and voltages exceeding their specified values, and the failure rate (FR) — or the probability of failure during use conditions — is calculated based on voltage and temperature acceleration factors. In this work, various types and lots of polymer tantalum capacitors have been tested at highly accelerated life test (HALT) conditions and the acceleration factors have been determined using different techniques.
It has been shown that the behavior of capacitors under HALT conditions can be described based on the time-dependent dielectric breakdown (TDDB) model, which explains the presence of infant mortality (IM) and wear-out failures using the same failure mechanisms and allows for an assessment of the acceleration factors. The difference in acceleration factors obtained using exponential and power models is discussed. Analysis shows that with proper derating, screening, and qualification testing, the reliability of frameless Hi-Rel COTS polymer tantalum capacitors is adequate for space missions.
The paper was presented by Alexander Teverovsky, Jacobs Engineering, Inc./NASA GSFC, USA at the 3rd PCNS 7-10th September 2021, Milano, Italy as paper No.2.3.

Introduction
The reliability of high quality MnO2 tantalum capacitors is determined for each parts lot during screening using the so-called Weibull grading test (WGT). This test is typically carried out for 40 hours at 85 °C and voltages exceeding the rated voltage by 20 % to 50 %, thus providing a significant acceleration to the degradation process. The reliability acceleration factor used for the calculation of WGT results in MIL-PRF-55365 is an exponential function of voltage and can be presented in the equation:


where B is the voltage acceleration constant that is assumed to be 18.77 for all capacitor types, and u is the test voltage normalized to the rated voltage, u = V/VR.
The applicability of WGT is based on the fact that most MnO2 capacitor failures are related to the presence of defects in the dielectric that result in infant mortality (IM) failures. This failure mode is revealed by the slope of the time to failure (TTF) distributions in Weibull coordinates b < 1, which indicates a reduction of the failure rate (FR) with time of operation. Due to the prevalence of IM failures, it is often assumed that these parts do not have wear-out (WO) failures and the major reliability assurance technique is to reduce FR to the required level, as it is done during screening by WGT. However, field-induced crystal growth that can eventually rupture the dielectric [1, 2] and migration of positively charged oxygen vacancies that increases leakage currents with time of operation [3] are typical WO mechanisms that have rather high activation energies, from 1 eV to 1.2 eV.
The probability of IM failures in chip polymer tantalum capacitors (CPTCs) is much lower than in MnO2 parts, and for this reason WGT is not applicable [4]. Assuming that the distribution of TTF is exponential (b = 1), the failure rate can be calculated based on the life test results as:

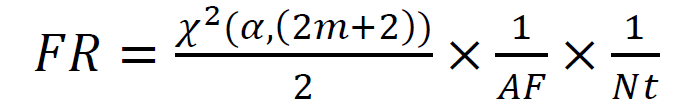
where χ2 is the chi-square function, a is the confidence level, m is the number of failures, N is the number of tested samples, t is the duration of the test, and AF is the acceleration factor that depends on test voltage and temperature.
Considering that a life test is typically carried out at the specified temperature and rated voltages for 1000 hours using 100 samples, the failure rate is 2.3E-5 = 2.3 % / 1000 hours, even if the group passed the testing without failures (m = 0). At this failure rate, the probability of failure during a 10-year mission will be ~87 %, which is unacceptable for Hi-Rel systems.
The only practical way to get FR assessments for Hi-Rel CPTCs is by evaluating acceleration factors that can generally be presented as a product of voltage and temperature acceleration factors, AF = AFV ×AFT. In most cases, the temperature acceleration factor follows the Arrhenius law and can be characterized by the activation energy, Ea:


where k is the Boltzmann constant, and T1 and T2 are operation and test temperatures.
The voltage acceleration factor can be characterized by the constant B and Equation 1, which was also used to describe highly accelerated life (HALT) test results for MnO2 capacitors [3]. Note that the exponential function for AFV, which had been determined empirically by multiple tests while developing the WGT procedure, can also be derived based on the physics of failure approach (PoF). This approach considers failures in tantalum capacitors as a time-dependent dielectric breakdown (TDDB) model [5]. Another possibility to express voltage dependence of acceleration is by using a power function:


where n is the constant, and V1 and V2 are test voltages.
This presentation of AFV was originally derived empirically by Prokopowicz and Vaskas [6] for accelerated testing of ceramic capacitors. E. Reed and co-workers used this function to determine AFV for CPTCs based on HALT results, and to predict the reliability of capacitors under use conditions [7, 8]. The same dependence is suggested in the draft of the military standard for CPTCs [9]. According to [7], the voltage acceleration constant n for low voltage capacitors rated to 6 V is in the range from 10 to 19, and activation energies decreased from 1.75 eV at rated voltages to 1.25 eV at u = 2. Later studies for higher voltage ratings, from 25 V to 50 V, showed similar TTF distributions and the calculated values of n were in the range from 18 to 24 and Ea decreased from 1.37 eV at u = 1.8 to 0.87 eV at u = 2.1.
Unfortunately, there is only limited information regarding acceleration factors in CPTCs. It is not clear how AF values differ for different capacitor lots, what the best way to approximate voltage dependence of AF is, or how to use HALT for selection of adequate burn-in (BI) conditions. In this work, multiple lots of four types of frameless tantalum capacitors were tested at different HALT conditions to assess voltage and temperature acceleration factors and the reliability of parts under use conditions. The testing results have been evaluated using different methods that allow for assessment of the lot to lot variations. The thermochemical model of TDDB was used to explain the presence of IM and WO failures during HALT.
Experiment
Four types of frameless polymer tantalum capacitors were used for this study. 22 uF/ 25 V capacitors are general-purpose commercial parts, and the rest were Hi-Rel COTS+ capacitors. Each part type was presented in two to four lots to assess the reproducibility of acceleration factors. HALT was carried out at 85 °C and 105 °C and test voltages varying from 1.6 to 2.4 times the rated voltage, as shown in the test matrix in Table 1. Each group of capacitors tested at a specific temperature and voltage had from 120 to 150 samples, except for lots L2a, L3, and L4, which had 40 samples.


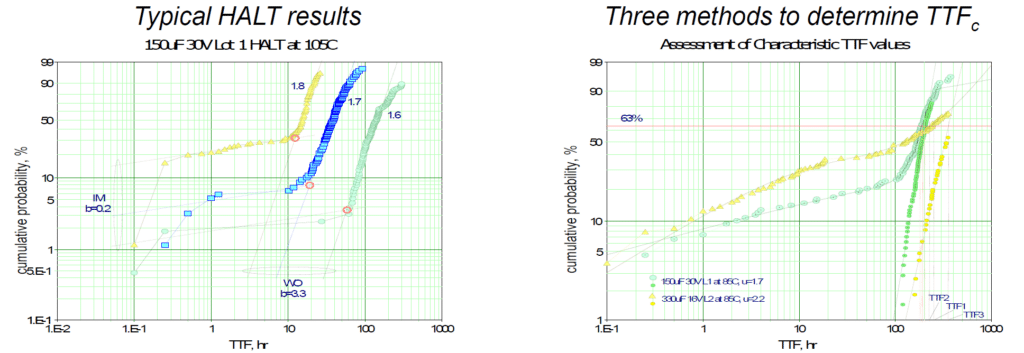
Typical test results of HALT at different stress levels indicate the presence of IM and WO failures, as shown in Figure 1a. These distributions are similar to those obtained by KEMET in [4, 8, 10] and also feature a certain proportion of the initial and so-called anti WO failures that deviate from the distributions at high TTF values.
For adequate assessment of the acceleration factors, it is important to make sure that the mechanism of degradation at different stress levels remains the same. This can be done by assessing the slopes of TTF distributions in Weibull coordinates, b. The similarity of the slopes for the relevant TTF distributions indicates the same mode of failure and can be used as a proof that the same mechanisms caused failures at different stress levels. At this condition, only the scale factor, h, or characteristic time to failure, changes with the stress. Note that on Weibull plots, h corresponds to 63 % of failures.
In many cases, the proportion of IM failures was relatively small and did not allow for selection of sections of the distributions with the same slopes. For this reason, estimations of the characteristic times and acceleration factors were determined for WO failures. Possible assessments of the AF values for IM failures will be considered in the discussion section of this paper.
In this study, three methods to get the characteristic times of WO failures, as shown in Figure 1b, were used. According to method M1, TTF1 values were obtained directly from the chart at the 63 % level; in method M2, TTF2 values were calculated by approximation of the experimental data with a two-mode distribution (Weibull 7++ software available from ReliaSoft). In method M3, TTF3 was assessed for WO failures at other data suspended. As a result, characteristic times to failure TTF1, TTF2, and TTF3 were obtained and their voltage dependencies, TTF(u), were approximated using exponential and power models to get values of B and n for each group of parts and the three methods of TTF estimations. The accuracy of approximations was assessed by the R2 values. The activation energies were calculated by an approximation of TTF(T) dependencies with the Arrhenius function.

Test results
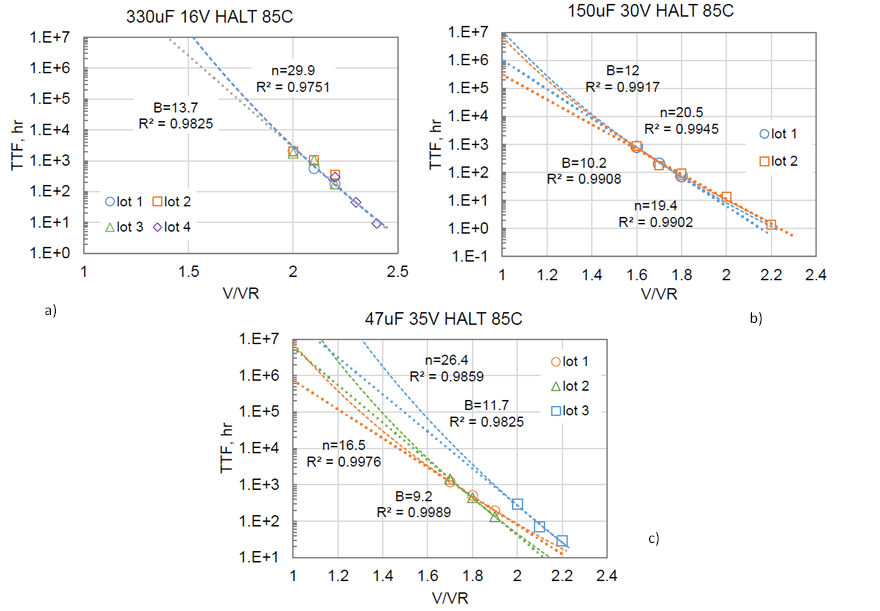
The results of approximation of experimental data using exponential and power functions per Equations (1) and (4) for TTF values determined based on WO distributions (method M3) are displayed in Figure 2. The relevant voltage acceleration constants and R2 values are shown on the charts and indicate that both functions allow for a good approximation (R2 > 0.9). Extrapolation of HALT results to the rated voltages indicate TTF values of more than 1E6 hours (more than 100 years), but the power law gives predictions that are several times more than an order of magnitude greater compared to the exponential model.

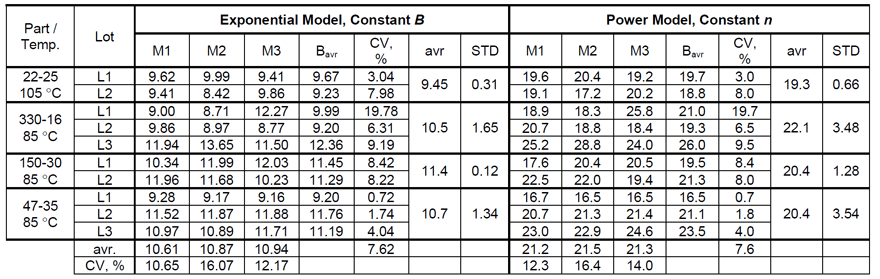
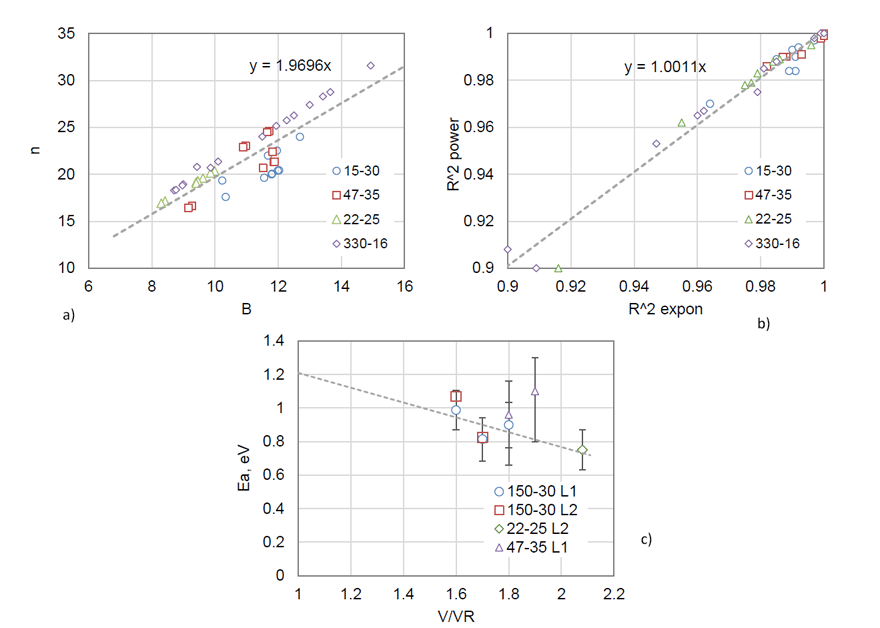
Voltage acceleration constants calculated based on TTF values obtained using different methods are displayed in Table 2. Average values of the constants and the coefficients of variations (CV) are shown for each parts lot. According to these data, the accuracy of estimates of B and n values is similar and ranges from 1 % to 19 %, avaraging at 7.6 %.
Lot to lot variations of the volatage acceleration constants are relatively small, within 16 %. It appers that different types of polymer capacitors can be characterized by the same voltage acceleration constants B = 10.9 ± 0.8 and n = 21 ± 1.2. Note that the values of n are within the range of data obtained by Reed and Haddox [8]. It is possible that the intrinsic voltage acceleration constant determined for WO failures depends mostly on the type of the dielectric, and to a lesser degree on the part type.
There is a good correlation between the constants, and as Figure 3a shows, constant n is on average two times greater than B. R2 values that characterize the accuracy of approximations are above 0.9 and are practically identical for the two methods of approximation (see Figure 3b). Activation energies estimated for several capacitor lots were in the range from 0.7 eV to 1.35 eV, and although different methods of the TTF estimations resulted in a rather significant variations of Ea values, there is a trend of increasing Ea with decreasing of the test voltage, as shown in Figure 3c. At rated voltages, Ea is expected in the range from 1 eV to 1.2 eV, which is in the range of values for MnO2 tantalum capacitors [1, 3].


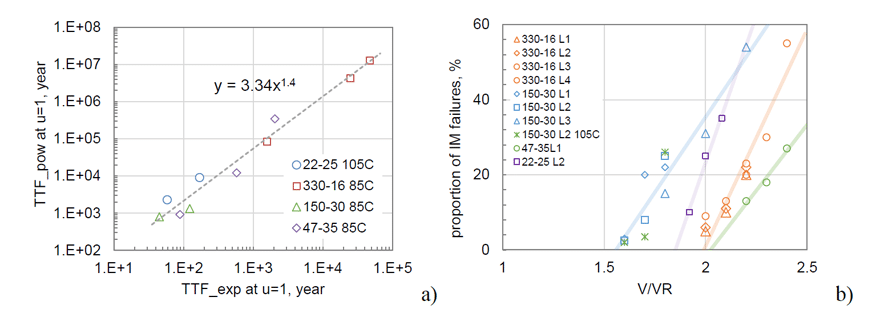
Extrapolations of TTF(u) dependencies similar to those shown in Figure 2 allow for calculation of the TTF values at the rated voltages, TTF(u=1). A correlation between TTF(u=1) values calculated using exponential and power functions is shown in Figure 4a. Both approximations predict that at 85 °C and rated voltages, the characteristic times exceed 50 years. However, the exponential function gives much more conservative estimates. For example, for a lot with the 50-year predicted value based on Equation (1), TTF(u=1), the power approximation per Equation (4) is ~780 years. For larger TTF values, the discrepancy is even greater, and at TTFexp(u=1) = 5000 years, TTFpow(u=1) = 50 ,000 years.
For TTF distributions that allowed for assessment of the proportion of IM failures, PIM, these values are plotted against the stress voltage in Figure 4b. There is a clear tendency of increasing PIM with the level of stress; however, the proportion of IM failures at rated conditions are difficult to assess accurately.

HALT Simulation
Failures in all types of capacitors, and polymer tantalum capacitors in particular, can be considered as time dependent dielectric breakdown (TTDB). The thermochemical theory gives an exponential dependence of TTF, with the electric field in the dielectric [11]. Assuming that the normalized breakdown voltage of a capacitor is uBR, TTF at the stress u can be written as:

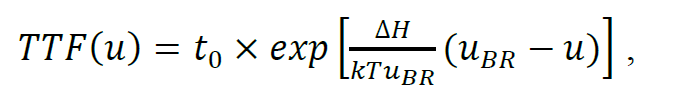
where T is the temperature, DH is the activation energy required for displacement of ions from their normal bonding environment, and t0 is the time at breakdown (u = uBR).
Note that this equation can be converted to Equation (1) at

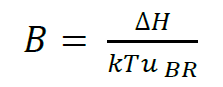
Because B depends on uBR, it is not, strictly speaking, a constant, but varies for different samples in the lot. However, variations of uBR for polymer capacitors are typically small, below ± 10 %, and for this reason, possible variations of B within the lot are also ~10 %, which is close to the accuracy of the experimental assessments for the constant.
During measurements of breakdown voltages, the voltage across the capacitor is gradually increasing, so for a few seconds the part stays at voltages close to uBR. For this reason, we can assume t0 = 0.001 hour. Estimations show that the effective activation energy for tantalum capacitors is in the range from 1 eV to 2 eV [3, 11]. According to the field-induced crystal growth theory, the time to failure can also be expressed using a similar exponential function with activation energy of ~ 1.2 eV [1]. This model also explains the increasing reliability activation energy with the decreasing test voltage that was observed in [8] and in this study.
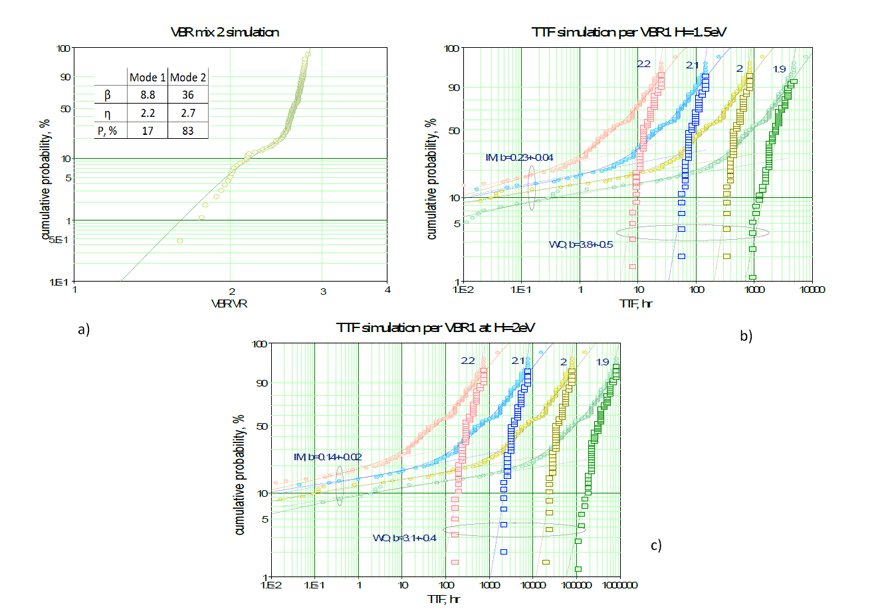
Normalized breakdown voltages in tantalum capacitors are typically well below the formation voltage that in high quality parts is 3 to 3.5 times greater than the rated voltage and can be considered as the ultimate breakdown of the part. The characteristic breakdown voltages are typically 2.7 times greater than the rated voltages [12], and the distributions of uBR often have a low voltage subgroup indicating parts with defects. For TTF simulations, a Weibull distribution of uBR was generated using a two-mode Monte Carlo simulation with characteristic breakdowns at 2.2 and 2.7 and slopes 8.8 and 36, respectively, for mode 1 (parts with simulated defects) and mode 2 (normal quality parts). The proportion of the low voltage group simulating the presence of defective parts was 17 % (see Figure 5a).
Results of HALT simulation at 85 °C and test voltages in the range from 1.9 to 2.2 are shown in Figs. 5b and 5c for DH = 2 eV and 1.5 eV, respectively. The shape of the TTF distributions is similar to the experimental data and indicates the presence of IM and WO failures. This means that the same degradation mechanism can result in both types of failures, depending on the severity of the defects in the dielectric represented by breakdown voltages.
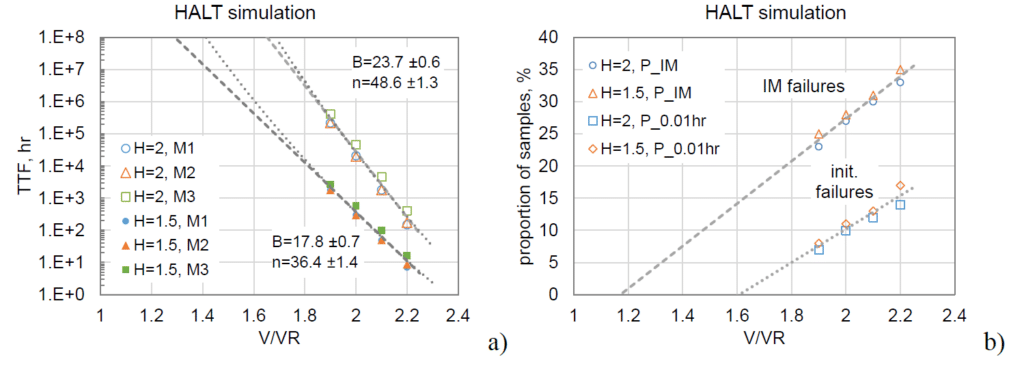
Variations of TTF determined based on Figures 5b and 5c with the normalized test voltage are shown in Figure 6a, and were used to assess voltage acceleration constants per exponential, Equation (1), and power, Equation (4), models. The values of constant B were 17.8 ± 0.7 and 23.7 ± 0.6 for simulations with activation energies of 1.5 eV and 2 eV, respectively.
Similar to the experimental results, TDDB simulations resulted in the constant n approximately two times greater than B, and the TTF values predicted for u = 1 were substantially greater for the power model. The proportion of the initial and IM failures does not depend significantly on the activation energy DH and decreases at reduced stress levels, as shown in Figure 6b, which is also in agreement with the experimental data.

Discussion
Results of HALT allow for estimations of reliability characteristics of the parts at the use conditions. For WO failures, the characteristic time or median time to failure are not the major indicators of reliability, because they correspond to times when 63 % or 50 % of the parts fail. For Hi-Rel, and in particular space, systems, times to first failures are more important. Assuming the time to failure inception or useful life of the parts corresponds to the probability of failure of 0.1 %, this time can be calculated using a Weibull function:

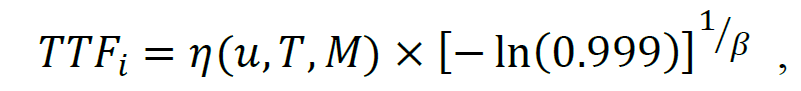
where h(u,T,M) is the characteristic time to failure calculated using model M (exponential or power models) at temperature T and normalized voltage u.
The probability of failure during a 20-year mission (175 200 hours), for example, can be calculated as:

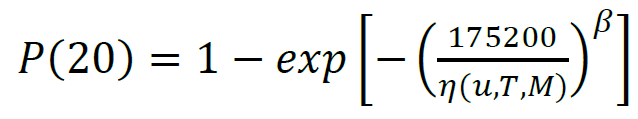
Using these equations and experimental data, reliability characteristics for the tested lots are displayed in Table 3. Columns 4 and 5 of the table show characteristic times calculated by extrapolation of TTF(u) dependencies for WO failures to the rated voltage (u = 1).
The times to failure inceptions are up to 14 times lower than the characteristic TTF values, and the difference increases at lower b. For the power model, TTFi predictions are 10 to 280 times greater than for the exponential. The discrepancy is even greater, more than five orders of magnitude, between the values of P(20). Nevertheless, even a conservative, exponential model for most of the tested lots gives P(20) below 0.1 % at the rated conditions. To reduce this probability further, the parts should be used at reduced stress levels.


For the assessment of reliability at derated conditions, Equations (7) and (8) should be used at the characteristic times calculated using temperature and voltage acceleration factors:


where AFV(M) is the voltage acceleration factor calculated per Equation (1) for the exponential or Equation (4) for the power model, and the temperature acceleration factor AFT is calculated per Equation (3).
Results of these calculations for typical acceleration conditions are show in Figure 7. A reduction of voltage by 20 % of VR will increase TTFi by 5 to 11 times according to the exponential model, and much more aggressively, by 36 to 210 times, according to the power model. An example of HALT data and expected distributions of WO failures at voltages derated to 80 % VR are shown in Figure 8a. Even at 85 °C, conservative estimates yield useful life at derated conditions that substantially exceed typical mission requirements. By reducing the use temperature from 85 °C to 65 °C, the useful life can be increased by 4 to 18 times, and further reduction of the use temperature to 45 °C will increase it by 17 to 450 times. Using the example in Figure 8a, the useful life for the parts operating at 80 % VR and 65 °C will be more than 250 years. Even the conservative, exponential model predicts extremely low, below 2.5E-12, probability of WO failures during 20-year missions (see last column in Table 3).


In all HALT cases, TTF distributions indicated the presence of the instant (before ~0.01 hour) and IM failures. These failures can be simulated using TDDB model and bi-modal distributions of VBR, where the parts with the lowest VBR comprise the group that creates instant failures during the initial few minutes of testing. The low voltage subgroups are responsible for IM failures that can last for hundreds of hours, and their proportion depends on the level of stress. Experimental data and modeling suggest that the proportion of IM failures increases with the level of stress substantially and is below a few percent at u < 1.5. Because the proportion of IM failures is relatively small and the characteristic times are large, their accurate modeling using HALT is difficult. However, these early failures might pose a serious risk for space missions, and defective capacitors should be screened out using adequate BI conditions.


Possible BI conditions can be selected using modeling of HALT results. For tantalum capacitors, BI is typically carried out at 85 °C for 40 hours. In the presence of WO failures, the voltage during screening should be selected so that the test would not reduce the useful life of the parts. Figure 8b shows the results of HALT for 47 uF / 35 V capacitors and predictions for BI conditions that are carried out at 1.3 times the rated voltage. The inception time of WO failures for BI conditions is 2E5 hours, so the 40-hour testing will not consume the resources of the part.
At the average voltage constants for the tested lots B = 10.9 and n = 21, the 40-hour BI testing at u = 1.3 would be equivalent to 1100 hours and 10 000 hours of testing at the rated voltage for the exponential and power models, respectively. Burn-in at these conditions removes practically all IM failures from the lot, as evident from the 10 000-hour testing of 40 samples at 85 °C and rated voltages, as shown in Figure 9. Note that leakage currents did not degrade during these tests and remained 2 to 3 orders of magnitude below the specified limits. Conservative estimates show that at voltages derated to 80 % VR, the equivalent duration of this test would be 6 to 12 years, and 63 to 457 years at 50 % derating.


To assure the necessary quality and high reliability of these capacitors, life tests at 105 °C and rated voltages are carried out for 2000 hours using 120 samples soldered onto test PWB. Note that using the acceleration factors shown in Figure 7b, 2000-hour testing at 105 °C, is equivalent to testing at 65 °C for more than 10 years.
Based on the life test results, the failure rates at the application conditions can be calculated for each lot using Equation (2). The results of these calculations for typical application conditions at 85 °C or 65 °C, and voltages of 80 % or 50 % of the rated voltage, are shown in Table 4. Conservative estimates show that at 85 °C, the failure rates are less than 0.02 % to 0.04% for 1000 hours at 80 % derating, and 0.002 % to 0.0005 % for 1000 hours at 50% derating. A more aggressive power model that is suggested in the draft for the military-grade polymer tantalum capacitors [9] predicts much lower failure rates, below 0.003 % for 1000 hours at 85 °C and u = 0.8 to below 1E-6 % for 1000 hours at 65 °C and u = 0.5. Apparently, even conservative estimates predict FR values that are acceptable for most space projects.


Conclusion
HALT was carried out using 10 lots of four types of polymer tantalum capacitors at temperatures of 85 °C and 105 °C, and voltages from 1.6 to 2.4 times the rated voltage, to assess reliability acceleration factors and their variability between different lots and part types. Modeling of TTF distributions allowed for predictions of the reliability at use conditions and selection of burn-in conditions for screening.
Variations of the characteristic times to failure with voltage were approximated using exponential and power models that were characterized by the voltage acceleration constants B and n, respectively. Three methods that were used to evaluate the characteristic times to failure yielded similar results and the accuracy of the constant’s estimations was ~8 %. Lot to lot variations of the constants were below 16 % and different part types used in this study had similar voltage acceleration constants, B = 10.9 ± 0.8 and n = 21 ± 1.2.
Both models allow for equally accurate approximations of the experimental data. However, the exponential model gives a more conservative prediction of reliability at the use conditions compared to the power model. The times to failure inception at the rated conditions is 10 to 280 times greater, and the probability of failure for 20-year missions is orders of magnitude lower for the power model.
Analysis shows that major features of TTF distributions during HALT might be explained using the thermochemical model that presents failures of capacitors as TDDB. This model validates exponential dependence of voltage acceleration factors, explains the presence of IM and WO failures using the same degradation mechanism, and predicts the increasing of the proportion of IM failures with the level of stress.
Conservative assessments of the reliability of Hi-Rel COTS frameless polymer tantalum capacitors show that at the rated voltages and 85 °C, the time to failure inception exceeds 10 years. The probability of failure during a 20-year mission at derated conditions (65 °C and 0.8 VR) is below 1E-11. This level of reliability is acceptable for most space missions.
Acknowledgment
This work was sponsored by Vishay and the NASA Electronic Parts and Packaging (NEPP) program. The authors are thankful to Bruce Meinhold, SSAI ESES III Group Manager / SME, Parts, Packaging, Advanced Technologies for their review and discussion of this manuscript.
References
[1] B. Goudswaard and F. J. J. Dreisens, “Failure mechanism of solid tantalum capacitors,” Electrocomponent Science and Technology, vol. 3, pp. 171-179, 1976
[2] Y. Freeman, Tantalum and Niobium-Based Capacitors: Science, Technology, and Applications: Springer, 2017.
[3] A. Teverovsky, “Degradation of leakage currents and reliability prediction for tantalum capacitors,” in 2016 Annual Reliability and Maintainability Symposium (RAMS), Tucson, AZ, 2016, 25-28 Jan., pp. 1-7.
[4] E. Reed and C. Caetano, “New Reliability Assessment Practices for Tantalum Polymer Capacitors,” presented at the ESA 1st International Symposium ‘Space Passive Component Days’, Noordwijk, The Netherlands, 2013. https://escies.org/webdocument/showArticle?id=984&groupid=6
[5] A. Teverovsky, “Analysis of Weibull Grading Test for Solid Tantalum Capacitors,” in CARTS Europe, Munich, Ge, 2010, November 10-11, pp. 103-120. http://ecadigitallibrary.com/pdf/CARTSEUROPE10/3_1.pdf
[6] T. I. Prokopowicz and A. R. Vaskas, “Research and development, intrinsic reliability, subminiature ceramic capacitors,” ECOM, Alexandria, VA, USA 1969,
[7] J. L. Paulsen, E. K. Reed, and J. N. Kelly, “Reliability of Tantalum Polymer Capacitors,” in CARTS 2004: 24th Annual Capacitor and Resistor Technology Symposium, 2004, 29 March – 1 April, 2004, pp. 114-121.
[8] E. Reed and G. Haddox, “Reliability of High-Voltage Tantalum Polymer Capacitors,” in CARTS International, Jacksonville, FL, 2011, March 28-31, p. 3.3.
[9] MIL-PRF-POLY, 2021, General specification for capacitors, fixed, electrolytic (conductive polymer), surface mount, non-established reliability and established reliability, https://landandmaritimeapps.dla.mil/Programs/MilSpec/ListDocs.aspx?BasicDoc=MIL-PRF-POLY
[10] E. K. Reed, J. N. Kelly, and J. L. Paulsen, “Reliability of Low-Voltage Tantalum Polymer Capacitors,” in CARTS USA 2005, Palm Springs, CA, 2005, March 21-24, 2005, pp. 189-198.
[11] J. W. McPherson, J. Kim, A. Shanware, H. Mogul, and J. Rodriguez, “Trends in the Ultimate Breakdown Strength of High Dielectric-Constant Materials,” IEEE transactions on electron devices, vol. 50, pp. 1771-1778, August 2003 2003
[12] A. Teverovsky, “Breakdown and Self-healing in Tantalum Capacitors,” IEEE Transactions on Dielectrics and Electrical Insulation, vol. 28, pp. 663-671, 2021