

R1.1 RESISTIVITY (ρ)
The resistivity, ρ, is a material constant. The higher the resistivity in the resistor material, the higher its resistance. The connection can be described as
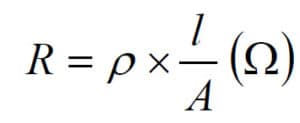

………………………… [R1-1]
Here
R = resistance
l = conductor length
A = conductor area.
Depending on what units we express l and A in we get different units of ρ. A common way is by expressing l in m(eter) and A in mm2 ρ then gets the unit Ωmm2/m. If we instead choose l in m and A in m2, the unit for ρ will be Ω x mm2/m, which usually is transformed to Ωm. That unit often is used for non-metallic materials. If we know the value of ρ expressed in Ωmm2/m, that value has to be multiplied by the factor 10-6 to give the value in Ωm. Thus, 10-6 x Ω×mm2/m = 1 Ωm.
R1.2 SHEET RESISTIVITY (Ω/square)
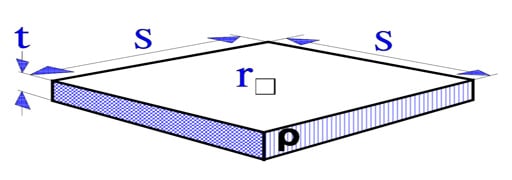

Figure R1-1. Surface resistivity r(sq) [Ω/square].
The sheet resistivity is a measure of the resistance per surface unit of resistive films. A square surface element as shown in Figure R1-1 gets according to the formula [R1-1] the resistance:

…………………[R1-2]
Thus, the resistance per square unit, r(sq), is independent of the surface size. It is the film thickness and its intrinsic resistivity that determine r(sq) (expressed in Ω/square).
R1.3 SURFACE TEMPERATURE and HOT SPOT


Figure R1-2. Temperature rise versus Load. Ta = ambient temperature.
The surface temperature rise of the resistor body depends on the load as shown in principle in Figure R1-2. As temperature rises, conduction, radiation and convection (air-cooling) from the resistor body increases which causes the temperature curve to level off.
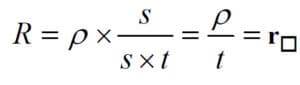
Figure R1-3 shows the temperature distribution along a resistor body. Thermal dissipation to the leads or SMD terminals decreases the temperature at the ends. In the middle of the body we register a temperature maximum, the so called Hot Spot temperature. This temperature determines both the resistor stability and life.
It is important that spiraling or wire winding be spread uniformly over the whole free resistor length. Otherwise we get an intensified Hot Spot effect that endangers life and stability.
It is not only for the resistor itself the Hot Spot is of vital importance. Heat radiation may have an effect on adjacent components and circuit boards. Thus, see that there is a satisfactory distance to the resistor body from heat-sensitive adjacent components.
Figure R1-3. Temperatures:
Thsp = Hot Spot temperature.
Ta = ambient temperature.
R1.4 THERMAL TIME CONSTANT, τw
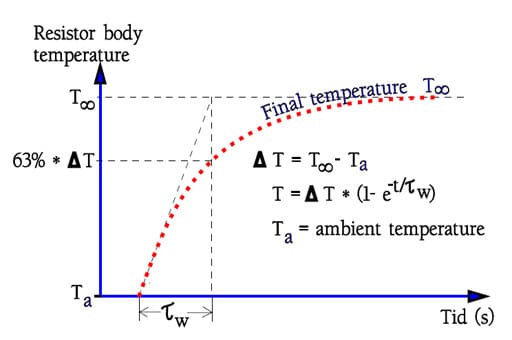
Figure R1-4. Thermal time constant,τw.
The thermal time constant, τw, is defined as the warm-up time for the resistor surface to attain 63% or theoretically (1-1/e) of the final temperature after applied load is increased in steps, usually PR (Figure R1-4). Of course, the time constant is strongly dependent on the resistor body size. It will be quicker to heat up a small body than a big one. Table R1-1 states standard values for some DIN classified sizes.
Table R1-1. Examples of thermal time constants and thermal resistances.
| DIN size[1] | 0204 | 0207 | 0414 |
| Thermal time constant, τw (s) | 2 | 5 | 20 |
| Thermal resistance, Rth (K/W) | 400 | 250 | 170 |
[1] Leaded cylindrical components.
R1.5 THERMAL RESISTANCE, Rth
The thermal resistance, Rth, is expressed in K/W. It describes the temperature increase of a resistor body under applied load. Since radiation causes the temperature curve to turn downwards at increasing load data about Rth concerns normalized mounting and a load of PR. (See DIN 44 050). As shown in Figure R3-5 an power overload reduces the Rth.
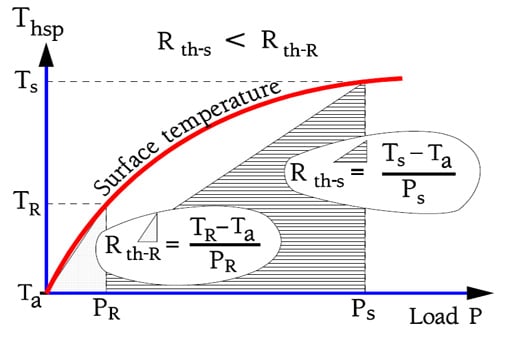
Figure R1-5. Thermal resistance at overload Ps and at rated power PR.
In Equation R1-3 the connection between Rth and current temperatures is described. Rth is expressed in K/W but due to the fact that the equation deals with the difference between two temperatures it doesn’t matter if we use °C or K for both values. The differences will be equally large. K2-K1 = [(°C2+273) – (°C1+273)] = °C2-°C1.
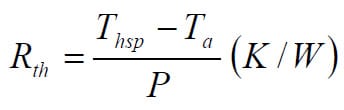

…………[R1-3]
Thsp = Hot Spot temp. in K or °C
Ta = ambient temp. in K or °C.
P = applied load, W.
In Table R1-1 there are some examples of the thermal resistance for standard DIN sizes.
R1.6 TEMPERATURE COEFFICIENT of RESISTANCE, TCR
The temperature coefficient of resistance, TCR, is expressed in ppm/°C.
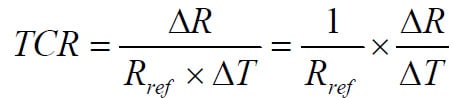

……….[R1-4]
For clarification reasons TC is often written TCR, i.e., Temperature Coefficient of Resistance.
Specification limits and actual changes may look like the ones in following figure where a family of components are shown.
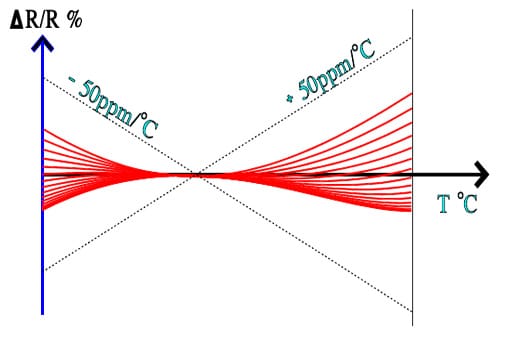
Figure R1-6. Example of specified TC limits and actual records.
ABC of CLR: Chapter R Resistors
Resistivity, Thermal Resistance and Temperature Coefficient
EPCI licenced content by:
[1] EPCI European Passive Components Institute experts original articles
[2] CLR Passive Components Handbook by P-O.Fagerholt*
*used under EPCI copyright from CTI Corporation, USA
![]()
This page content is licensed under a Creative Commons Attribution-Share Alike 4.0 International License.
