

The purpose of the work is to propose a method for predicting the reliability of a capacitor by leakage currents (DCL), which allows predicting the behavior of DCL, already at the initial stages of anode manufacturing, based on the mechanical tests, which significantly reduces the time and cost at its manufacture.
The paper was presented by Vladimir Azbel, independent consultant, Israel at the 3rd PCNS 7-10th September 2021, Milano, Italy as paper No.1.6.

Usually, deficiency of control methods in the early stages of manufacture of the product, with a multi-step process, leads to the search results of trial and error, which leads to a waste of time and money with a low probability of solving the problem. The reliability of the tantalum capacitor, its capacitance (CAP), and above all, the leakage currents, and their stability, are determined by the anode.
METHODS TO CONTROL RELIABILITY OF TANTALUM CAPACITORS FROM EARLY ANODE PRODUCTION STAGE
One of the ways to increase the reliability of the anode is the development of new effective control methods on the stage of its production. The anode is the heart of the tantalum capacitor.

Anode production – imagine how, as the two-stage process:
- the first stage is getting a sintered pellet.
- the second stage is getting anode, by the formation process of a sintered pellet. The CAP and DCL values of the anode, produced at the same powder, depend on choosing the parameters first and the second stage:
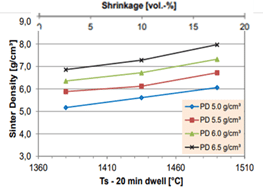
- for sintered pellet, this choice of the pressing density, and temperature sintering see fig.1 .
- The only controlled parameter of the process is shrinkage. It should be noted that shrinkage depends on the temperature/time of sintering and does not depend on the change in the pressing density at the same sintering temperature / 1/
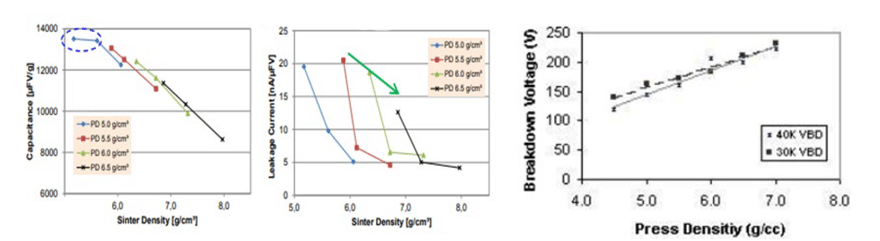
- the second stage is the formation of the process of the sintered pellets and define of CAP and DCL. see fig.2.
From, the obtained values of the CAP and DCL of the anodes, chosen the anode with acceptable values CAP and DCL, and the corresponding its pressing density, sintering temperature, and recipe formation.The compatibility of the above parameters of the sintered pellet and molding requires a significant amount of time due to the absence, at these stages, of control methods for predicting changes in CAP and DCL.

Despite the developer’s experience, this process is time-consuming and expensive.
Most of the tantalum capacitors manufacturers nowadays use for determining anode quality “wet-cell” tests (WC). The WC test is a good indicator of overall anode capacitance (CAP) and dissipation factor (DF) but insufficient to precise prognoses direct current leakage (DCL) on the final product and does not provide a direct connection to the structure of the sintered pellet.
The problem is that at present the quality assessment can be carried out only on the anode, and any deviation, in consisting of its components from the recipe process associated with the repetition of all stages of its manufacture.
Unfortunately, WC the test does not provide:
- current control of the sintered pellet, which is currently controlled by shrinkage, which has its own limitations / 1/.
- control defects, at each technological stage
- predicting risk degradation of the DCL in the final product.
The ability they are to control them will allow developing a method for modeling and predicting the reliability of the final product at the anode stage.
The anode is a composite material, consisting of a porous sintered pellet of tantalum powder, an amorphous oxide Ta2O5 film, and an interface between Ta – an amorphous Ta2O5 film.
The physical properties of a material (mechanical, electrical, etc.) are determined by its structure/4/. Often, change the mechanical and electrical properties of the material depend on the same structure.
Consider the possibility of estimate CAP and DCL of anode not by WC, but by mechanical tests, applied to porous materials.
The proposed method is based on recording the stress-strain curve of the material, which makes it possible to independently control, not only, changes in the porous structure, but and residual stress of the sintered pellet (at variations in the pressing density and sintering temperature), and the ability of the structure of the sintered pellet to resist the change, during the formation of an amorphous Ta2O5 film during the formation process.
The typical form of the CC curve and the parameters characterizing it are shown in Fig.3

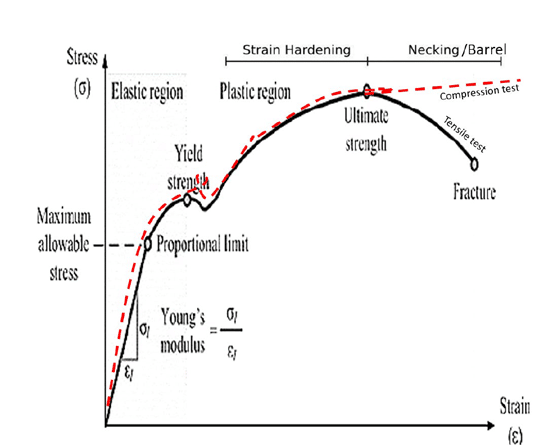
The stress-strain curve provides information about the structure, which affects its parameters of yield strength (Ay)/12/, Young’s modulus (E)/12/, ultimate tensile stress (AUTS), exponential hardening factor (n)/13/, which is also true for porous materials.
The characteristics of the SS curve are widely used to assess the quality and reliability of the material, in particular powder porous materials, after various technological processes subjected to mechanical, thermal, and chemical treatment.
In the case of a composite material, which is an anode, the stability of its properties: 1. first of all, will depend on the ability of its plastic matrix (sintered pellet) to withstand degradation caused by the formation process and 2. the keep of stability during exploitation.
An indicator, of the stability of anode properties, is the stability of its structure, after a reliability test, can be estimated by:
- standard method determined CAP and DCL on the capacitor
- suggested method / 5 /- Ay, E, and n determined from the SS curve of the anodes before and after heating in air, in the temperature/time range 400-450°C/20 – 60 min., should not exceed 10%.
For each characteristic Ay, E, AUTS, determined from the SS curve, and for CAP anode, were suggested models and equations that relate them to the porous of the material.
Experimental results, on the influence of porous on the characteristics of the SS curve of the material, allowed us to obtain equations connecting the characteristics E and Ay with the morphology of the porous structure of the material.
It was established, that/ 6,7/, Young’s modulus of a porous material decreases with increasing porosity and back, and can be described by the equation E=E0 (1-p/pc), where E is the modulus of porous material, with porosity, the corresponding density p, E0 – modulus of solid material, with density pc~ 1


On the other hand, the capacity of an anode (C ~ S / l) made of tantalum powder is directly proportional to the pore area (S) of a sintered pellet with a dielectric thickness (l) equal to that of the natural oxide.
Assume that all the pores are open, then can write E~1/C.
Contrary to E, which characterizes the volume of porosity in the material, the characteristic Ау in the porous material characterizes the size of the neck. The neck represents the area of contact between the primary particles of the powder. For the anode of a tantalum capacitor, the size neck is one of the main parameters, of its structure, which is responsible for the DCL/ 8,9/ . Increasing porosity, at the same grade powder, leads to a decreasing in the size of the neck (X) in the porous material, i.e. surface area (see fig.4) and inversely.
For the yield point stress, of porous materials, the following equation was obtained.
Ау=b*А0*(X/D)2
Where b is an empirical constant, Ay is the yield strength of the sintered porous material, А0 is the wrought material yield strength.
The empirical model presented in equation (10,11) clearly indicated the proportional dependence between sintered yield strength and on the square of neck size ratio and diameter prime particles. (With constraint that X / D did not exceed 0.5)
With an increase in porosity, the values of E, Ay, and AUTS decrease and conversely /8/. The above equations are applicable to materials in which, in the process of loading, in compression, before fracture is formed barrel, and value n, for these materials > 0.4.
The n value is in the range from 0 to 1, with n> 0.4 it means that the material is plasticity. The more n, the higher the resistance of the material structure to external influences. Therefore, the use of equations, for estimate changes in porosity or neck size sinter pellet, is correct, if n calculate from this sinter pellet at least 0.5.
We discussed the physical processes occurring in a porous material, which are responsible, both for the mechanical parameters of the material Ау and Е, as well as electrical ones, as the capacitance and leakage currents of a tantalum capacitor.
From the above, it is proposed to use the characteristics of the SS curve to control the manufacture of the anode, at each of its stages, by the parameters E, Ay, n, which makes it possible to reduce the time to identify the causes of DCL failures associated with both the current technological process, batch replacement, and with the conversion of the powder supplier, as well as in the development of new designs.
Let us move from theory to practice and show, based on experimental results, how the parameters of the SS curves, correlate with CAP and DCL, depending on the pressing density, sintering temperature, and formation pellets.

For this purpose, three groups of pellets have been prepared.
- pellets, with different press density, at the same powder batch, sintered temperature, and recipe formation
- pellets, sintered at different temperatures, from the same powder batch, press density, and recipe formation,
- sintered pellet, at different formation voltage, from the same powder batch, press density, and sintered temperatures,
Each group was divided into two parts, the one was used for determination E, Ay, AUTS, n, another CAP and DCL.
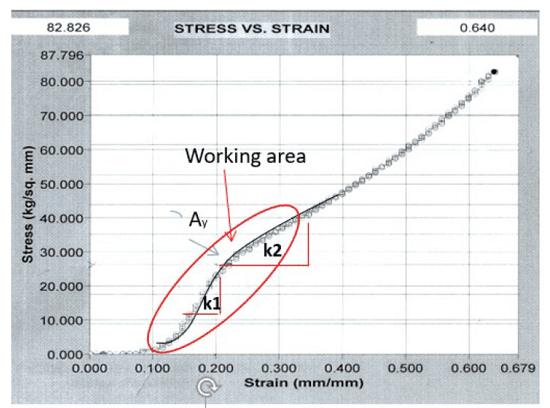
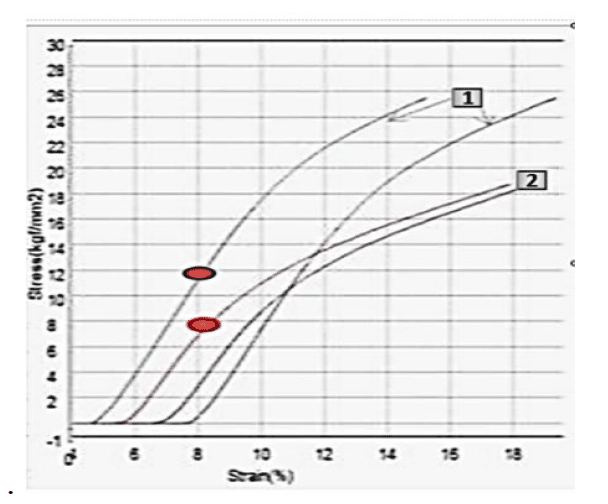
The samples were compression load, on machine type Instron and the SS curve was recorded. A typical SS curve for a compression test, of a plasticity material (pellet) (PWD. < 5KCV, pres. den. 7.5 g /cc, T°C / min-1850/30) and its parameters Ay, E ~ k1 and, n~ k2 is shown in Fig.5
HOW TO CONTROL FEATURES OF THE SINTERED PELLET
1.The influence of the press density
For the convenience of comparing and analyzing the results of the parameters Ау, к1, and к2, with the CAP and DCL, the present them in the form of a table 1.


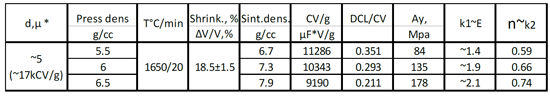
As can be seen from the table, the shrinkage value of pellets, pressed with different densities and sintered at the same temperature does not change and is not an indicator of changes in the porous structure. Currently, control of the sintered pellet, by volume shrinkage.
A higher in the press density pellet leads to an increase (see table 1):
- E~ k1- decrease porosity sinter pellet and a decrease in the CV/g
(CV/g) of anodes produced from these sintered pellets.
- Ay ~ cross-sectional area of the neck, at the same recipe formation (current formation), leads to a lower risk of overheating and degradation DCL.
- n ~ resistance of the sintering pellet structure, the process formation, that lead to lower DCL/CV
2.The influence temperature sintering
The influence temperature sintering on Ay and k1 of sintered pellets and CV/g anode, performed on them, are shown in Fig. 7.


As can be seen from Fig7, an increase in the sintering temperature, similar to an increase in the pressing density (see tab.), leads to an increase in Ау, к1 and a decrease in CAP (CV/g) change.
3.The influence time sintering
The influence time sintering on Ay and k1 of sintered pellets and CV/g, DCL/CV anode, performed on them, are shown in table 2.
As can be seen from the table, an increase in the sintering time leads to similar changes CV/g and DCL/CV as an increase in the pressing density and sintering temperature.

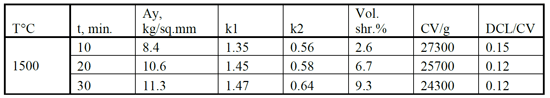
From the experimental results presented, it can be seen, that there is a correlation between the parameters Ay, k1 of the sintered pellet and CV/g, DCL/CV of the anode, depending on the variation of the pressing density, temperature, and sintering time.
The correlation between E, k1, which is responsible for the porosity of the sintered pellet, and CV/g, which is responsible for the anode surface, is clear.
At the same time, to predict DCL, the Ay parameter is used, which is responsible for the size of the neck of the sintered pellet and the recipe for the formation of the anode.
4.The influence formation process
The anode is a composite material, and unlike the test used to predict the stability of the DCL on the final anode, the mechanical test it possible to make such an estimate of the compatibility of the parameters Ау and the length of the plasticity region (Ls) of the sintered pellet and Av and Lv after formation (on the anode) (see Fig.8,9). The parameters Ay and the Ls of the sintered pellet, depend on powder, the press. density, temperature/time of sintering, and Av, Lv, from recipe formation (formation voltage and current, etc).
Figures 8 and 9 show two extreme cases, the existence (see Fig.8), and miss (see Fig.,9), of compatibility in the parameters Ау- Av, and Ls -Lv.
For the criterion of the compatibility of the parameter Ay with Av, the value q = Av-Ay is taken, which should increase in direct proportion to q = k * FV (where k is a constant), and Lv remains equal in magnitude to the q* Ls
A decrease in the Lv in compare Ls, and the miss of a correlation between Ay and Av, with an increase in FV, leads to an increase in the risk of growth in DCL.
The above schemes of the effect of formation voltage on the size neck, indicate an increase in the risk of overheating during formation.


5. Using for test for acceptable powder different vendors
Table 3, shown the standard controlled parameters, of the sintered pellet/anode, produced from powders of one grade, but differ vendors (1and 2) which: pressed, sintered, and formed (FV-330V), under the same conditions.
The difference, vendor powder, leads to differing significantly, DCL. Table 3

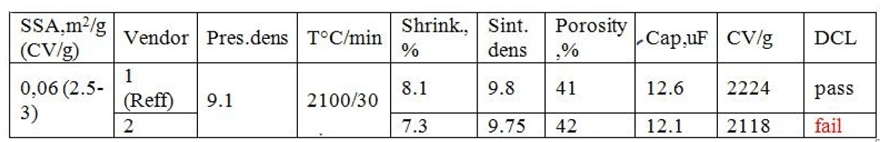
On sintered pellet from acceptable and problematic batches, SS- curves were obtained. It was found, that σy of vendor 2 is less (see fig. 10). Probably these led to problems with DCL.

In table 4, besides the standard controlled parameters, adding data from SS curve (see fig. 10)

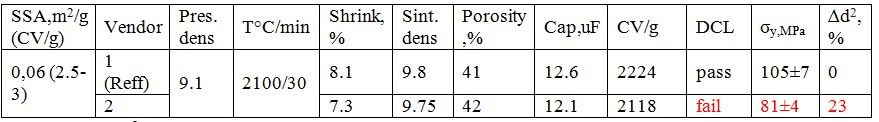
∆d2, is the change in percent, the neck cross-sectional area calculated by σy
As discussed above, lower, of value Ay, correspond to a smaller cross-sectional area of the neck. Under the same formation recipe, this increases the risk of overheating, and consequently the crystallization amorphous film Ta2O5, that lead to increases residual stress / /and DCL.
Differences in yield strength, despite the same surface area (CV/g) of the sintered product, indicate differences in powder production technology, which is critical for the capacitor manufacturer.
Therefore, the comparison of the size of the neck obtained from the stress–strain curve, after sintering, allows predicting the acceptance of the powder in the early stages of production, significantly reduces the time and cost spent for powder conversion.
6. Using for test for acceptable powder different batch
After receiving from the vendor powder, in more than 40 acceptable batches, beginning problems with DCL.
All other, controlled characteristics were within the permitted limits.
On sintered pellet from acceptable and problematic batches, SS- curves were obtained. It was found, that σy of the problematic batches is less than see tab. 5. Probably these led to problems with DCL, for the reason discussed in the previous section. Table 5

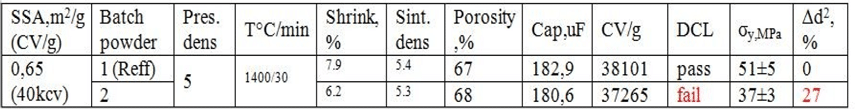
∆d2, is the change in percent, the neck cross-sectional area calculated by σy
7. Using SS curve for monitoring the influence of the shape of the sintered pellet on Ау and leakage currents.
Pellets A and B were prepared at the same: grade powder, press density, temperature/time sintering, formation voltage have at the same shrinkage, and content oxygen.
As can be seen from Fig. 16, the anode, produce by sintered pellet B, has low values of Ау and burns out (red circle fig.16) on formation.


In the manufacture of the anode, for the capacitor 15µF-50V E-case, the design of the anode used in the manufacture of 10µF-50V D-case was taken, with the same footprint, but height is 30% less in than uses in E-case. At the same production recipe, the leakage currents in E-case were almost an order of magnitude higher, in comparison to D-case, and the value of Ay is 30% lower. An increase in the sintering temperature of the sintered pellet used in the E-case made it possible to increase more by 25% Ау, and the DCL decreased, to the values of the anode D -case.
SUMMARY & CONCLUSION
The proposed method makes it possible to control the quality of the sinter and anode in comparison with their benchmark values E and Ay (curve SS), for which acceptable electrical characteristics of the anode were obtained.
Using of mechanical test could help to:
- Improve effectiveness of powder conversion. (since allow direct measurements and comparison of pellet with different powders at different manufacturing steps)
- Control pelleting “process” to reduce lot-by-lot variation (for special products).
- Reduce cost and increase effectiveness of new pellet developing. (achieving measurable data at early manufacturing steps)
- Evaluate effectiveness and necessaries of different manufacturing steps/treatments.
- Specific Ta pellets design optimization.
Acknowledgment.
I would like to thank Dr. Tom Zednicek, for the helpful discussions and help to prepare the article.
REFERENCES
- Ivensen V.A. Sintering Phenomenology and Some Questions of Theory 1985.248 s.
- Highest capacitance at higher voltages: Pushing the limits of tantalum high voltage capacitors Marcel Hagymási, H.C. Starck GmbH, Germany SPCD Noordwijk, Netherlands, 11.-14. October 2012 nd Space Passive Component Days (SPCD), International Symposium
- Magnesium Vapour Reduced Tantalum Powders with Very High Capacitances Helmut Haas CARTS Europe 2004: 18th Annual Passive Components Conference, October 18-21, 2004
- 21.On the existence of a correlation, the temperature changes in the mechanical strength and electrical resistance of certain metals V.A Churaev Solid State Physics v.33 N2,1991
- Mechanical stress of anodized pellet predicts the Ta-capacitor reliability V. Azbel on LinkedIn
- Correlation between Young’s modulus and porosity in porous materials J.KOVACIK Journal of materials science letter s 18 (1999) 1007-1010
- N. Ramakrishnan and V.S. Arunachalam, J. Am. Ceram. Soc., (1993) 76 2745-2752
- “Neck” Key Leakage Currents (DCL) Ta capacitor V. Azbel on LinkedIn
- A new approach to anode tantalum capacitor production V. Azbel on LinkedIn
- Randall M. German Materials Transactions, vol.42, No.7 (2001) pp 1400-1410 The Japan Institute of Metals
- Characterization of loose powder sintered porous titanium and Ti6Al4V alloy Ziya ESEN, Elif TARHAN BOR Article in Turkish Journal of Engineering and Environmental Sciences ·August 2009
- STRUCTURAL SENSITIVITY OF HARDENING PARAMETERS Yu.N. Podrezov Физика и техника высоких давлений 2010, том 20, № 4 Physics and technology of high pressures 2010, vol. 20, no. 4
- Theoretical Calculation of the Strain-Hardening Exponent and the Strength Coefficient of Metallic Materials Zhongping Zhang, Qiang Sun, Chunwang Li, Journal of Materials Engineering and Performance Volume 15(1) February2006
- Strain hardening behaviors in sintered Fe–0.8%C–1.0%Si–0.8%Cu powder metallurgy preforms during cold upsetting A Rajeshkannan and S Narayan Mechanical Engineering, The University of the South Pacific, Suva, Fiji 2010