by Vlasta Sedlakova, Josef Sikula, Jiri Majzner, Petr Sedlak
CEITEC, Brno University of Technology, Brno, Czech Republic
presented by V.Sedlakova at the 2nd PCNS 10-13th September 2019, Bucharest, Romania as paper 3.4.
Abstract
Degradation of supercapacitor (SC) is evaluated during aging tests. Continuous current cycling for 100% energy and 75% energy and discontinuous cycling for 75% energy, respectively, was performed on two different types of supercapacitors. SC parameters are determined before the aging test, and during 6×10⁵ cycles of all three current cycling tests.
Capacitance fading within the current cycling tests is correlated to the results of capacitance change within the calendar life tests at different temperatures and operating voltage. Two studied SCs technologies show different sensitivity to temperature and electric field during the calendar tests as well as slightly different evolution of capacitance during cycling. We show that the capacitance fading is driven by two mechanisms.
The first one can be covered by the exponential function of square root of time of ageing, while the second one is described by the Gaussian function. The first ageing mechanism, related probably to the electrolyte parameters degradation, is observed for all the tested samples, while the second mechanism emerge only in case of hard testing conditions – elevated temperature and/or increased operating voltage.
We suppose that the second ageing mechanism is related to the electrode active area degradation caused probably by the decrease of potential barrier on the electrode/electrolyte interface. Further is shown that, for the same cycling current, the longer charge/discharge time accelerates the SC’s degradation.
Introduction
Supercapacitor (SC) is an energy storage device with high energy density, low self-discharge rate and relatively long life-time. Time of life is influenced by the operating temperature, applied voltage as well as the charge/discharge current [1 to 3]. The SC cells have a high cycle life because of the chemical and electrochemical inertness of the activated carbon electrodes.
However, in the time scale of months, experience shows a performance fading of the SC, which consists of capacitance decreasing and ESR increasing [4 to 8]. The degradation rate due to the cycling ageing test is much higher than the degradation rate due to the calendar ageing test with equivalent voltage and temperature [1 to 3].
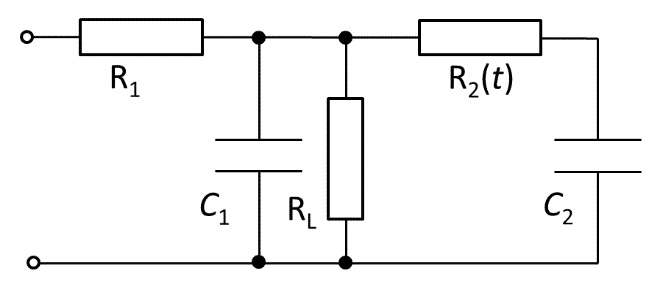
This research gives the analyses of the impact of ageing modes on the SC performances by monitoring of DC capacitance and DC ESR as well as the parameters of a physical-based equivalent circuit model (see Fig. 1). The supercapacitor is modelled by the circuit consisting of two ideal capacitors, two ideal resistors and one resistor with the time dependent resistance value.
The capacitors C1 and C2 are representing the capacitance of Helmholtz double layer CH and the increase of capacitance due to the diffusion of charges in the electrolyte CD, respectively. The resistors are representing the equivalent series resistance R1 and the parallel leakage resistance RL, respectively. The resistor with time dependent resistance R2(t) represents the diffuse resistance between the Helmholtz and diffuse capacitances, which is increasing with the time of SC charge/discharge [4].

Two experimental methods were used to investigate the SC ageing: (i) Energy cycling tests – discontinuous 75% energy cycling test (D75%), continuous 75% energy (C75%), and continuous 100% energy cycling test (C100%), respectively, at temperature 25°C, and (ii) Calendar life tests at different operating voltages and temperatures. Constant electric field at given temperature set for the appropriate Calendar test results in capacitance fading and ESR increase of tested SC.
We show, that the capacitance fading is driven by two mechanisms. The first one can be covered by the exponential function of square root of time of ageing, while the second one is described by the Gaussian function. The first ageing mechanism is observed for all the tested samples, while the second mechanism emerge only in case of hard testing conditions – elevated temperature and/or increased operating voltage.
The aim of energy cycling tests is to determine how the variable electric field and the induced self-heating influences the degradation process of capacitance and equivalent series resistance, respectively [1 to 3, 9]. On the results determined for the C100% and C75% tests, where the cycling current of the same value is used, while the end-of-discharge voltage varies, we will show, that the longer charge/discharge time accelerates the SC’s degradation.
Experimental
The experiments were carried out on two types of supercapacitors with nominal capacitance 10 F and nominal operating voltage Vop = 2.7 V. One set of samples denoted as “Old” are of the standard production, while the second set denoted as “New” represents the prototype with modified technology.
The energy cycling test is based on periodic charge/discharge current pulses up to the maximum operating voltage (Vop). The charge/discharge current value was 2.7 A for both C75% and C100% energy cycling tests and 1.35 A for D75% test, respectively. Cycling was performed in the voltage range 0 to 2.7 V for C100% test and in the range 1.35 to 2.7 V for both C75% and D75% tests.
The duration of one cycle depends on the capacitance of SC. The charge/discharge current value was designed to have the cycle duration set to 20 seconds for C100% test, 10 seconds for C75% test and 40 seconds for D75% test (including 10 seconds of rest time after both charge and discharge of SC), respectively. However real cycle duration decreases with the capacitance drop. Total length of each 105 cycles was measured and the evolution of SC parameters is further shown as a dependence on the time of cycling.
Supercapacitor parameters were evaluated periodically after each hundred thousand cycles. In addition to DC capacitance (DC CAP) and DC ESR measured by standard test for both New and Old set of samples, the parameters of a physical-based equivalent circuit model [1, 4] were determined for the set of New samples.In the Calendar life tests the stored energy of the SC is sustained by maintaining the voltage at a constant value at given temperature. Five different test conditions (temperature vs. voltage value) were set for the SC life time estimation:
- -35°C/1.0Vop
- 22°C/1.0Vop
- 22°C/1.2Vop
- 45°C/0.8Vop
- 65°C/0.6Vop.
Supercapacitor parameters DC CAP and DC ESR were evaluated after 200, 400, 700 and 1000 hours and then each 1000 hours up to 9000 hours.
Results and discussion
The parameters of a physical-based equivalent circuit model Helmholtz capacitance CH, diffuse capacitance CD, equivalent series resistance R1 and diffuse resistance parameter RD0, respectively, determined for New samples within the cycling tests C100%, C75% and D75% are shown in Figs. 2 and 3. The method for these parameters determination is explained in detail in [1, 4].

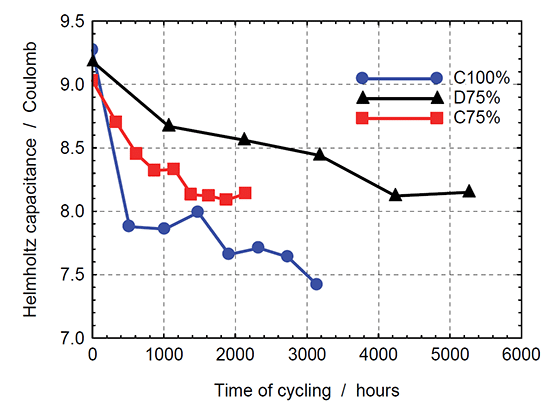

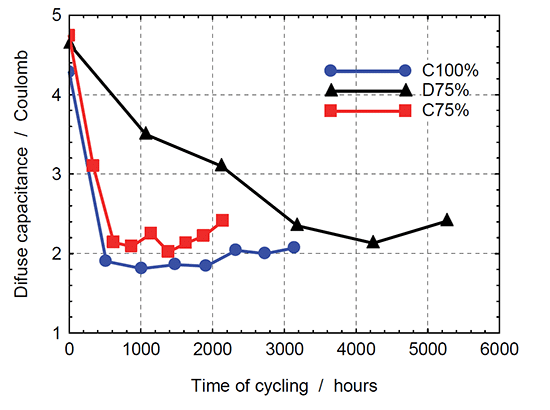
Fig. 2. Helmholtz capacitance CH (left graph) and diffuse capacitance CD (right graph) vs time of ageing for cycling test C100% (blue dot), C75% (red square) and D75% (black triangle) for New samples
While Helmholtz capacitance value continuously decreases with the time of ageing, the diffuse capacitance value drops down from about 4.5 C to about 2 C within initial 105 cycles for C100% test, and 2×10⁵ cycles for C75% test, respectively. Then the CD value remains constant for additional 4×10⁵ cycles for both C100% and C75% tests. Moderate increase of CD value is detected with further ageing. Similar behavior of CD value, but decelerated, is registered also for D75% test.
Diffuse resistance RD between Helmholtz and diffuse capacitance is given by (see [4]):

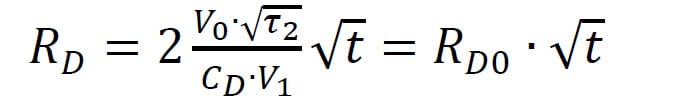
(1)
where
- V0 is the voltage at the beginning of diffuse capacitance charging,
- t2 is the time constant of diffusion process
- V1 is expected value of voltage at infinity
- CD is the diffuse capacitance
- RD0 is the diffuse resistance parameter which is equal to resistance RD value at time t = 1 s.
Diffuse resistance parameter RD0 increases with time of ageing, with the cycling current, as well as with the energy transferred through the SC within one cycle (see Fig. 3 – left). The highest increase is observed at the beginning of ageing. Diffusion processes in SC are related to the concentration and mobility of ions in electrolyte and to their distribution/concertation gradient in the vicinity of carbone electrode/electrolyte interface.
The dependency of diffuse capacitance as well as the diffuse resistance parameter on the time of ageing indicates that significant changes in electrolyte properties arrive shortly after the electric field application. The value of equivalent series resistance R1 determined from the charge/discharge experiment (see [4]) is shown in Fig. 3 – right. No significant increase of ESR is observed within the cycling tests.

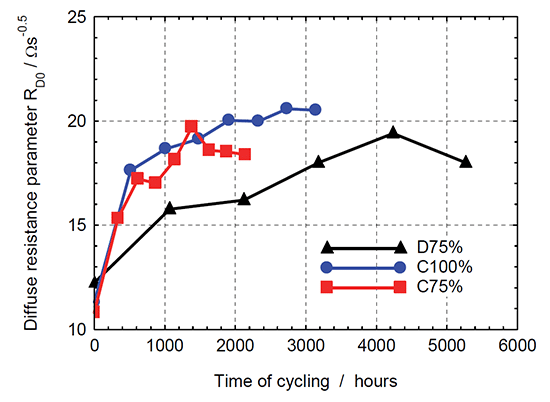

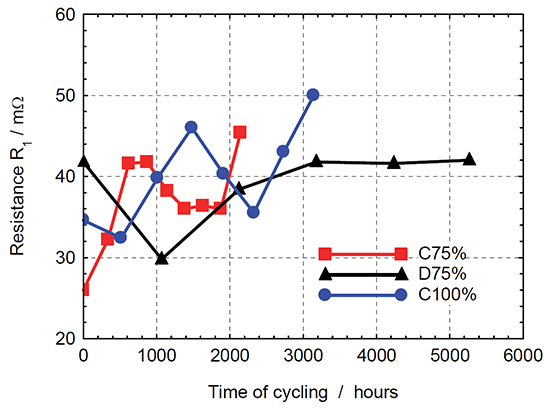
Fig. 3. Diffuse resistance parameter RD0 (left graph) and equivalent series resistance R1 (right graph) vs time of ageing for cycling test C100% (blue dot), C75% (red square) and D75% (black triangle) for New samples
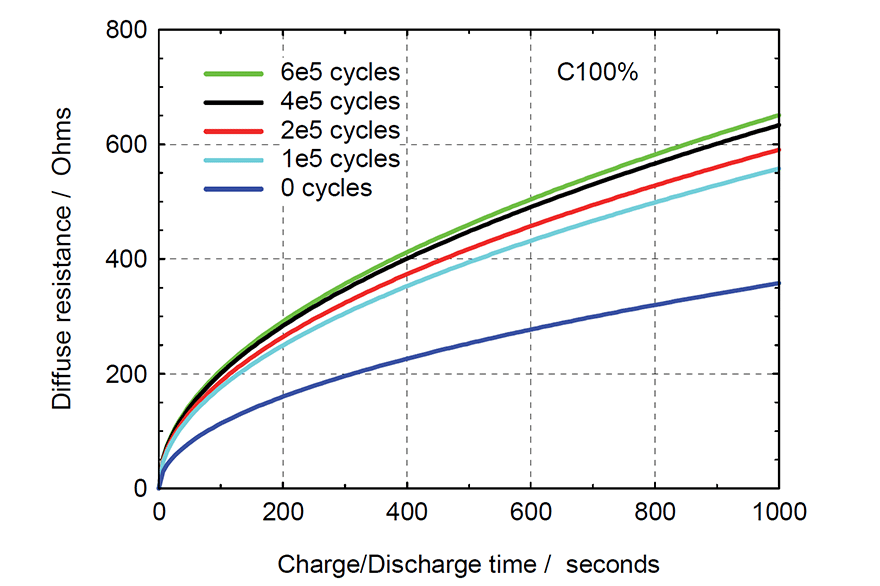
SC ageing by energy cycling test induces the increase of the value of resistance RD between Helmholtz and diffuse capacitances (see Fig. 4). This effect is more pronounced at the beginning of ageing. The value of diffuse resistance RD increases steeply after each change of current polarity. The longer lasts the charge or discharge, the higher is Joule heat generated on the diffuse resistance and the increase of SC’s internal temperature.

In addition to the parameters of a physical-based equivalent circuit model, DC capacitance (DC CAP) and DC ESR measured by standard test were determined for both New and Old set of samples. Figure 5 shows that the value of DC CAP is nearly equal to the Helmholtz capacitance CH value determined from the charge/discharge test cycle [1], [4]. For the assessment of capacitance fading with the ageing time the dependence of DC CAP on the time of ageing was evaluated for both cycling and calendar ageing tests.
The dependences of DC CAP on the time of ageing for C100% cycling test at room temperature and for the calendar life test performed at 22°C/1.0Vop for New samples are shown in Fig. 6 – left graph. We can see that influence of current cycling on the capacitance fading is significant. The application of static electric field results in decrease for about 0.5 F, while the decrease for about 1.2 F is determined for the C100% cycling test after 2000 hours of ageing.

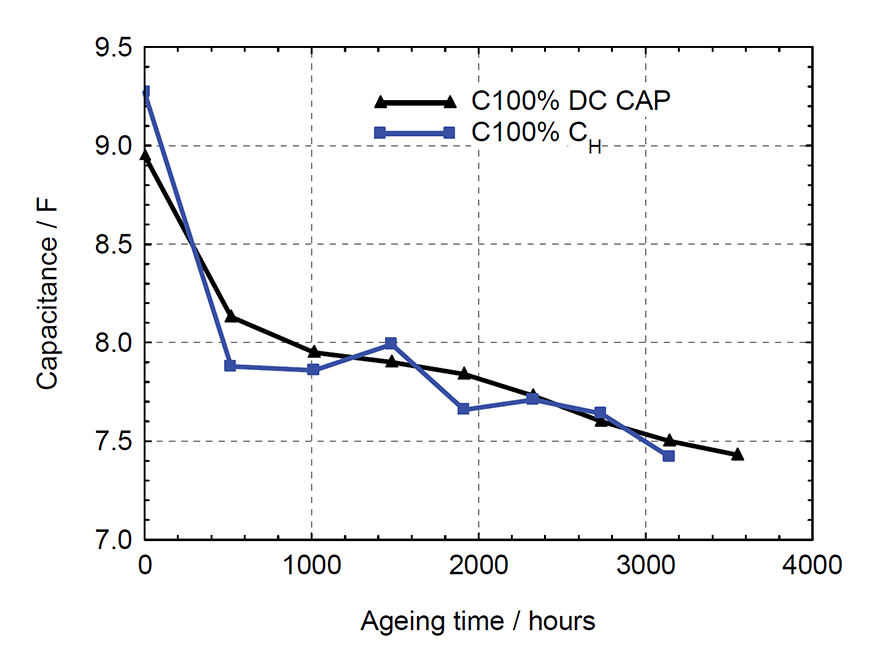

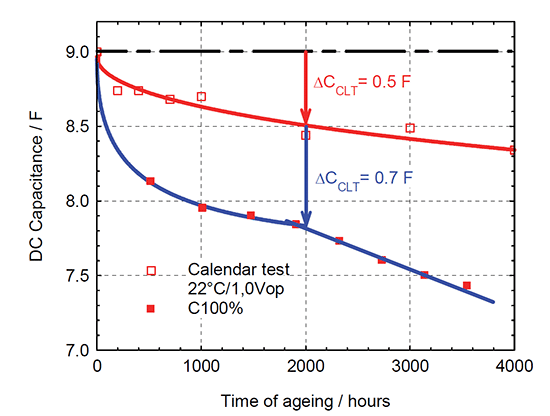

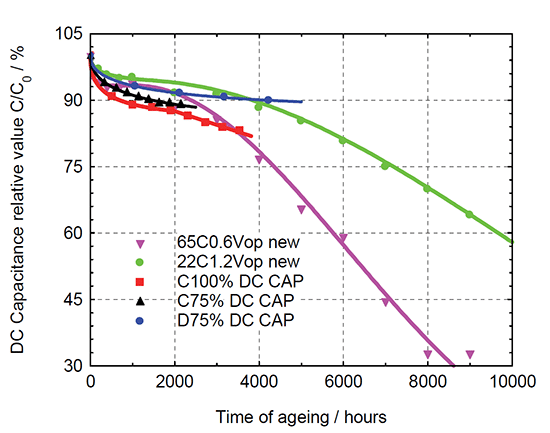
Fig. 6. DC capacitance vs time of ageing for C100% cycling test and 22°C/1.0Vop calendar life test (left graph) and DC capacitance relative value vs time of ageing for C100%, C75% and D75% cycling tests and 22°C/1.2Vop and 65°C/0.6Vop calendar life tests (right graph) – New samples

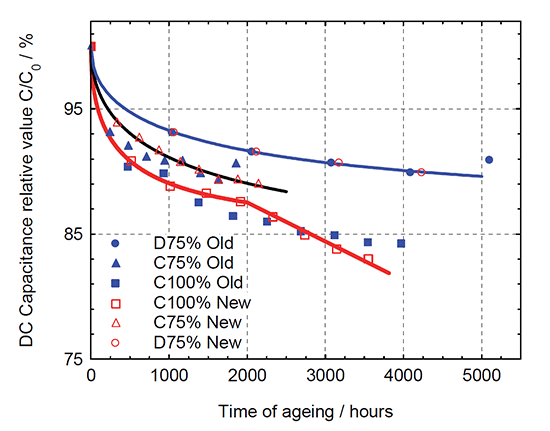

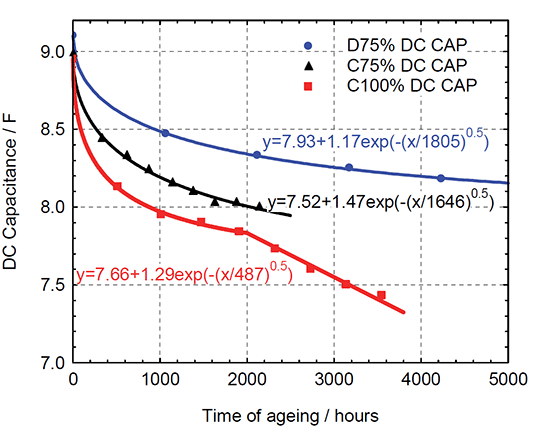
Fig. 7. DC capacitance relative value vs time of ageing for C100%, C75% and D75% cycling tests for both Old and New samples (left graph) and DC capacitance vs time of ageing for C100%, C75% and D75% cycling tests with appropriate fits of capacitance decrease at the beginning of ageing – New samples (right graph)
The dependences of DC capacitance relative value on the time of ageing for C100%, C75% and D75% cycling tests and 22°C/1.2Vop and 65°C/0.6Vop calendar life tests are shown in Fig. 6 – right graph for New samples. Capacitance decrease induced by the calendar life tests is lower at the beginning of ageing even in case of hard ageing conditions (applied voltage 3.24 V or elevated temperature 65°C, respectively). However after 2000 hours of ageing in case of elevated temperature and after 4000 hours of ageing in case of increased applied voltage, the abrupt decrease of capacitance is observed for samples under the calendar life tests. Abrupt decrease of capacitance starts at the point, when the capacitance value decreases for about 7 % due to the calendar life tests. This abrupt decrease of capacitance is detected also for the C100% cycling test, but here it is after the capacitance value decreases for about 12 %.
The dependences of DC CAP relative value on the time of ageing for C100%, C75% and D75% cycling tests for both Old and New samples are shown in Fig. 7 – left. The capacitance decrease induced by the C75% and D75% cycling tests is the same for both New and Old samples and could be covered by the exponential function in the whole studied ageing time interval. The results determined for C100% cycling tests differs after 1000 hours of ageing. While the results determined for Old samples could be covered by the exponential function in the whole studied ageing interval 0 – 4000 hours, the results for New samples could be covered by the exponential function in the range 0 to 2000 hours only, then an abrupt decrease of capacitance is detected for the C100% cycling test.
The dependences of DC CAP on time of ageing for C100%, C75% and D75% cycling tests are shown in Fig. 7 – right. These dependences are fitted by exponential function of square root of time in the time interval 0 to 2000 hours for C100% test and in the whole studied time interval for C75% and D75% cycling tests, respectively:

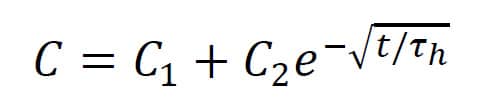
(2)
where
- t is time in hours
- C1 is capacitance value for time of ageing at infinity
- C2 is the capacitance decrease due to cycling
- th is time constant of energy cycling degradation process in hours
The values of these parameters obtained from experimental data fits for New samples are shown in Table 1.
Table 1. Constants evaluated from the experimental data fit of DC capacitance C vs. time of cycling for C100%, C75% and D75% cycling tests – New samples
| Cycling test | C (t = 0 h) / F | C1 / F | C2 / F | th / hour |
| C100% | 8.95 | 7.66 | 1.29 | 487 |
| C75% | 8.99 | 7.52 | 1.47 | 1646 |
| D75% | 9.10 | 7.93 | 1.17 | 1805 |
The value of constant th of energy cycling degradation process depends on the amount of energy dissipated in the sample volume within one hour. For C75% cycling test it is reasonably higher than for C100% cycling test. It is shown in Fig. 3 – right, that the ESR value is comparable for the samples subjected both to C75% and C100% cycling tests.
We suppose that the additional energy dissipation occurs on the diffuse resistance RD. Diffuse resistance is time dependent and it reaches the value of up to 25 W within each charge/discharge cycle of C75% test, while the value increases up to about 36 W within each C100% cycle at the beginning of ageing. These values increase to 40 W within each charge/discharge cycle of C75% test, and to about 63 W within each C100% cycle after 6 x 10⁵ ageing cycles.

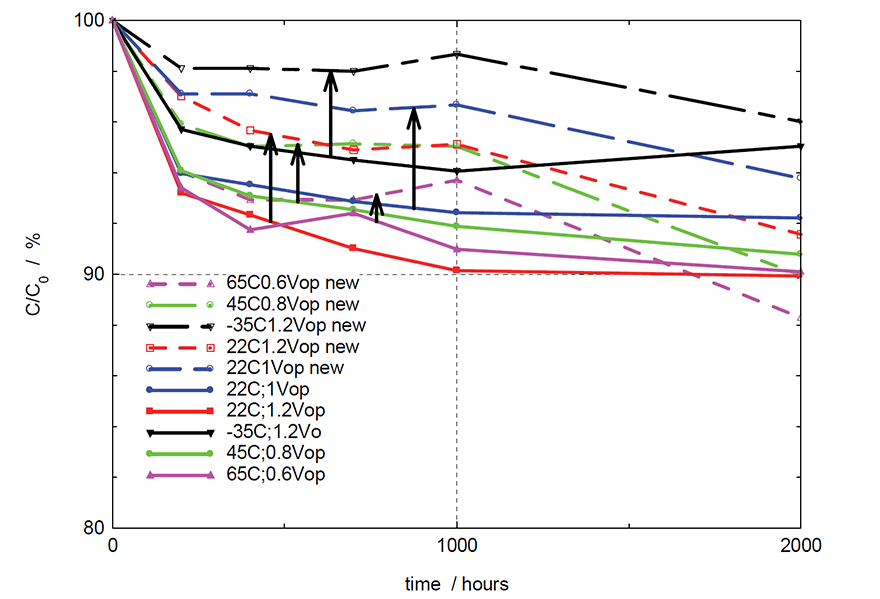
The dependences of DC capacitance relative value on the time of ageing during the initial 2000 hours of calendar life tests -35°C/1.0Vop; 22°C/1.0Vop; 22°C/1.2Vop; 45°C/0.8Vop; 65°C/0.6Vop are shown in Fig. 8 for both Old and New samples. Arrows indicate the difference between DC capacitance relative value of Old and New samples observed within initial 1000 hours of ageing.
Here the capacitance of samples of New technology shows much lower decrease with respect to the initial value than the samples of Old technology. The samples of New technology exhibit slightly different sensitivity to the ageing conditions. While the capacitance decrease during the initial 1000 hours is comparable for calendar life tests 22°C/1.2Vop and 65°C/0.6Vop of the Old technology, for the New technology the increased temperature of 65°C/0.6Vop test induces reasonably higher decrease of capacitance than the high electric field in 22°C/1.2Vop test.
Figure 9 shows the dependences of DC capacitance relative value on the time of ageing during 10000 hours of calendar life tests -35°C/1.0Vop; 22°C/1.0Vop; 22°C/1.2Vop; 45°C/0.8Vop; 65°C/0.6Vop for both Old and New samples. Contrary to the behavior within the initial 1000 hours of ageing here the samples of New technology show larger decrease of capacitance than the Old technology samples.
The decrease is evident especially for the calendar life test 65°C/0.6Vop. Modified technology is much more sensitive to the elevated temperature than the standard technology. This is visible also on the results measured for the test 45°C/0.8Vop – New, where the DC CAP relative value after 9000 hours of ageing is reaching 81 percent of the initial capacitance value and capacitance decrease accelerates. On the other side the results measured for the test 45°C/0.8Vop – Old show, that the DC CAP relative value after 10000 hours of ageing is reaching 88 percent of the initial capacitance value and capacitance decrease is stabilized between 3000 and 10000 hours of ageing.

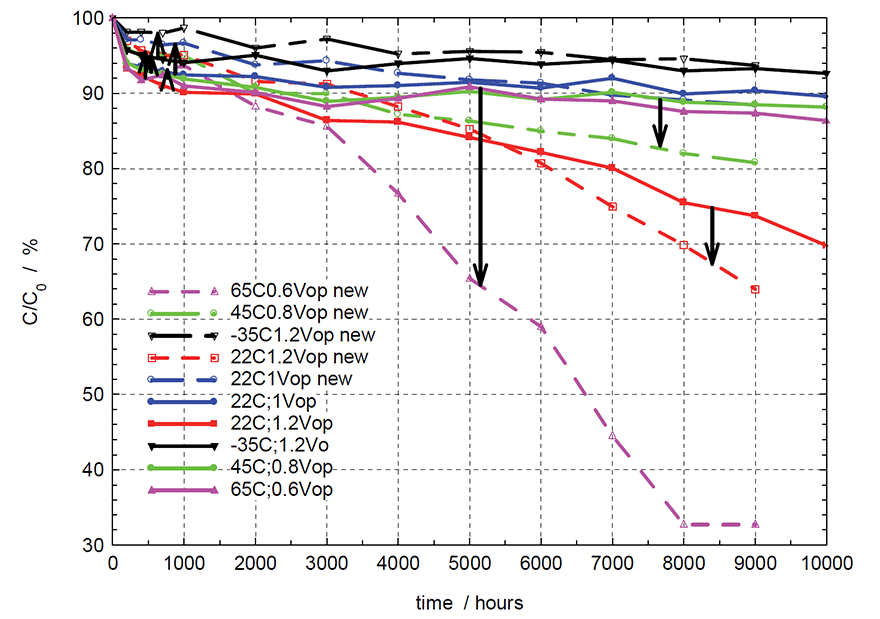

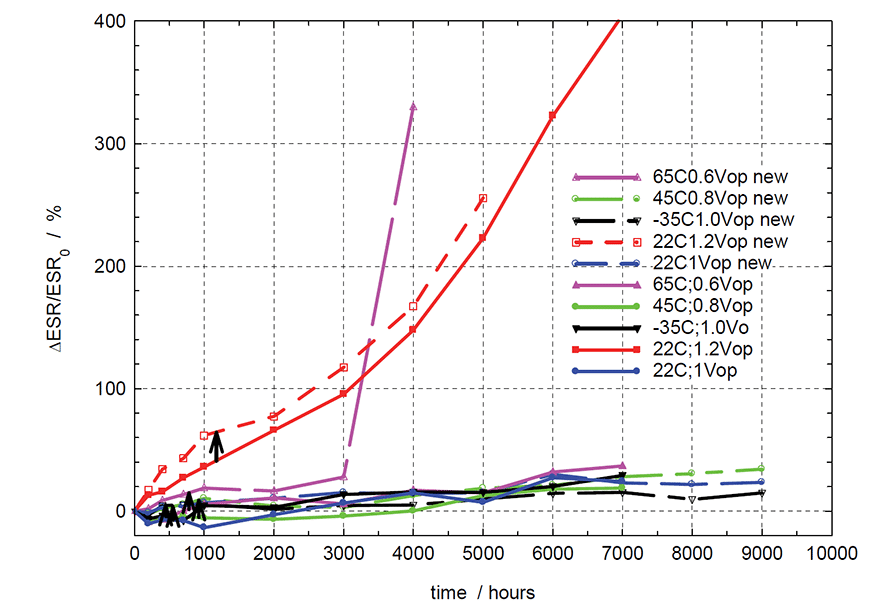
Figure 10 shows the dependences of DC ESR relative change on the time of ageing in time interval 0 to 10000 hours for calendar life tests -35°C/1.0Vop; 22°C/1.0Vop; 22°C/1.2Vop; 45°C/0.8Vop; 65°C/0.6Vop for both Old and New samples.
The increase of DC ESR over the 100% of its initial value is in correlation with the DC CAP relative value decreases below the 80% if the initial capacitance. For the samples of standard technology the ESR increase is related to the increased applied electric field, while for the modified technology the ESR increase is caused by both the increased applied electric field and increased temperature.


The dependences of DC CAP on time of ageing for all the calendar life tests could be fitted by exponential function of square root of time (see Eq. 2) either in the whole studied ageing time interval (the parts subjected to the moderate ageing conditions) or in the beginning of ageing only (the parts under hard ageing conditions – high electric field and/or high temperature).
Hard ageing conditions result in the abrupt decrease of capacitance, which is probably related to the decrease of electrode effective area due to the degradation of potential barrier on the Carbon-electrolyte interface. Similar behavior was observed also during the ageing of other Carbon electrode/electrolyte based structure – Lithium-Sulphur cells and is described in [10]. Capacitance decrease due to this degradation mechanism can be modeled by the Gaussian function:

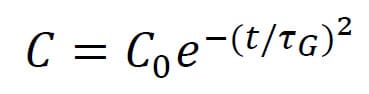
(3)
where
- t is time of ageing by the second degradation mechanism in hours
- C0 is capacitance value at the point, when the second degradation mechanism starts
- tG is time constant of the degradation process in hours.
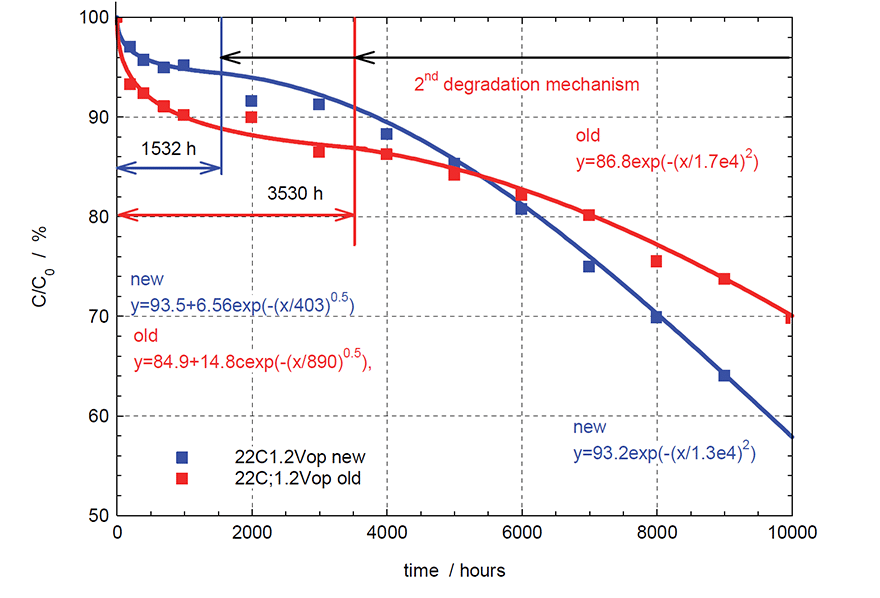
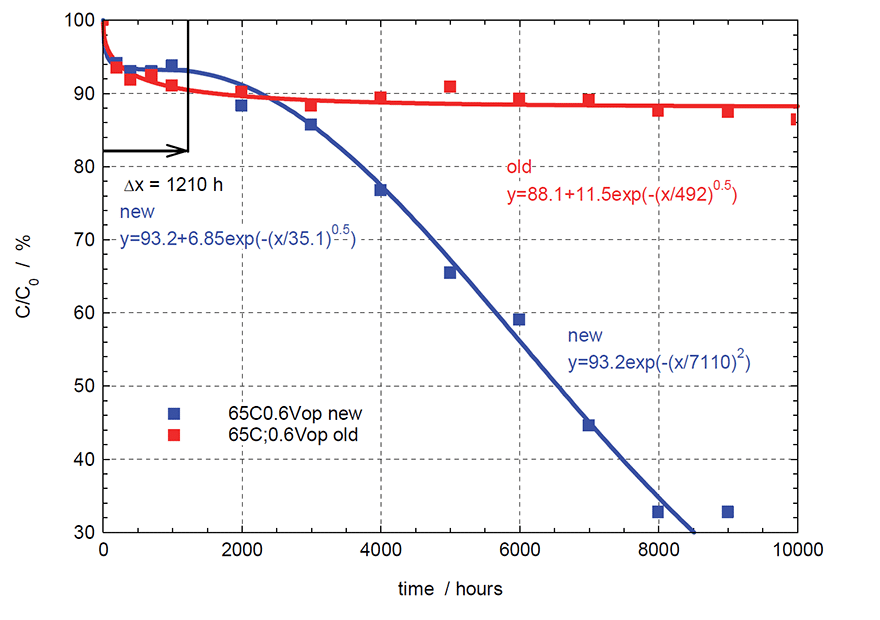
Figures 11 and 12 show the dependences of DC capacitance relative value on time of ageing for calendar life tests 22°C/1.2Vop and 65°C/0.6Vop. There are shown the measured data and data fit for both Old and New technology samples. The values of parameters obtained from experimental data fits for both New and Old samples are shown in Table 2.
New technology in comparison to the Old one is showing lower capacitance relative decrease due to the first degradation mechanism related to the electrolyte parameters modification, but the second degradation mechanism, related to the electrode effective area decrease, starts earlier and occurs due to the ageing under both increased electric field as well as under the elevated temperature.
The sensitivity of the Old technology to the elevated temperature is lower – capacitance decrease within the calendar life test 65°C/0.6Vop is covered by the first ageing mechanism in the whole evaluated time interval 0 to 10000 hours.
Table 2. Constants evaluated from the experimental data fit of DC capacitance C vs. time of ageing for calendar life tests 22°C/1.2Vop and 65°C/0.6Vop for both New and Old samples
| Calendar life test | First ageing mechanism – Eq. (2) | Second ageing mechanism – Eq. (3) | |||
| C1 / % | C2 / % | th / hour | C0 / % | tG/ hour | |
| 22°C/1.2Vop – New | 93.5 | 6.56 | 403 | 93.2 | 1.3 x 10⁴ |
| 22°C/1.2Vop – Old | 84.9 | 14.8 | 890 | 86.8 | 1.7 x 10⁴ |
| 65°C/0.6Vop – New | 93.2 | 6.85 | 35 | 93.2 | 7110 |
| 65°C/0.6Vop – Old | 88.1 | 11.5 | 492 | – | – |
Conclusions
We show, that the capacitance fading is driven by two mechanisms. The first one can be covered by the exponential function of square root of time of ageing, while the second one is described by the Gaussian function. The first ageing mechanism, related probably to the electrolyte parameters degradation, is observed for all the tested samples, while the second mechanism emerge only in case of hard testing conditions – elevated temperature and/or increased operating voltage.
We suppose, that the second ageing mechanism is related to the electrode active area degradation caused probably by the decrease of potential barrier on the electrode/electrolyte interface. Capacitance decrease induced by the first ageing mechanism is lower for the samples of New technology which results in lower capacitance fading within the initial 1000 hours of Calendar life tests, but then the degradation due to the second ageing mechanism become dominant in this technology for both elevated temperature and increased electric field test conditions and it leads to the accelerated capacitance degradation.
On the results determined for the C100% and C75% tests, where the cycling current of the same value is used, while the end-of-discharge voltage varies, is shown, that the longer charge/discharge time accelerates the SC’s degradation.
Acknowledgement
This research was carried out under the project CEITEC 2020 (LQ1601) with financial support from the Ministry of Education, Youth and Sports of the Czech Republic under the National Sustainability Programme II.
References
- Sedlakova V, Sikula J, Majzner J, Sedlak P, Kuparowitz T, Buergler B and Vasina P. Supercapacitor degradation assessment by power cycling and calendar life tests. Metrol Meas Syst, 2016, vol. 23, no. 3, p. 345-358.
- Paul Kreczanik, Pascal Venet, Alaa Hijazi, Guy Clerc. Study of Supercapacitor Ageing and Lifetime Estimation According to Voltage, Temperature and RMS Current. IEEE Transactions on Industrial Electronics, vol. 61, no. 9, September 2014, p. 4895-4902
- Murray D B and Hayes J G. Cycle Testing of Supercapacitors for Long-Life Robust Applications. IEEE Transactions on Power Electronics, vol. 30, no. 5, May 2015, p. 2505-2516
- Sedlakova V, Sikula J, Majzner J, Sedlak P, Kuparowitz T, Buergler B and Vasina P. Supercapacitor equivalent electrical circuit model based on charges redistribution by diffusion J. Power Sources, 2015, vol. 286, p. 58–65
- Sedlakova V, J. Sikula, J. Valsa, J. Majzner, P. Dvorak, “Supercapacitor Charge and Self-discharge Analysis” in Proceedings of Conference Passive Space Component Days, ESA/ESTEC, Noordwijk, The Netherlands, Sept. 24 – 26, 2013.
- Zubieta L and Bonert R. Characterization of double-layer capacitors for power electronics applications IEEE Trans. Ind. Appl. 2000, vol. 36, p. 199–205.
- Graydon J W, Panjehshahi M and Kirk D W. Charge redistribution and ionic mobility in the micropores of supercapacitors. J. Power Sources, 2014, vol. 245, p. 822–829
- Faranda R. A new parameters identification procedure for simplified double layer capacitor two-branch model. Electr. Power Syst. Res. 2010, vol. 80, p. 363–371
- Kaus M, Kowal J and Sauer D U. Modelling the effects of charge redistribution during self-discharge of supercapacitors Electrochimica Acta (2010) 55 7516–23
- Sedlakova, V., Sikula, J., Sedlak, P., Cech, O., Urrutia, L., A Simple Analytical Model of Capacity Fading for Lithium–Sulfur Cells IEEE Transactions on Power Electronics, vol. 34, no. 6, June 2019, p. 5779-5786.
more 2nd PCNS symposium technical papers can be viewed and downloaded in pdf from EPCI Academy e-Proceedings: