


This paper describes the physical background of the voltage-dependent capacitance of class II Multilayer Ceramic Capacitors (MLCC) and present models for this dependency.
The paper was presented by Frank Puhane, Würth Elektronik, Germany at the 4th PCNS 10-14th September 2023, Sønderborg, Denmark as paper No.2.3.
Two processes of the voltage-dependency can be distinguished, leading to an immediate as well as a long-term capacitance dependence on DC voltage. Both processes are related to the ferroelectric properties of class II materials.
The immediate process is related to the dipole reorientation within the material domain structure. The origin of the long-time DC effect, still discussed in the scientific community, is likely to be related to domain wall movement. We will also discuss the influence of the two processes on the application of MLCCs.
I. Motivation and Background
For the design-in process, it has become a common procedure to employ simulation software such as SPICE. The developer may load files for multilayer ceramic capacitors (MLCCs) into the software to simulate the influence of the voltage and frequency behavior of the MLCC on the circuit. To make this simulation computationally efficient, it is necessary to implement elegant mathematical models for the MLCCs.
This article briefly reviews the physical background of the voltage-dependent capacitance of class 2 MLCCs. Furthermore, it describes the mathematical polarization model’s development, suitable for simulation software implementation. An important dielectric property that ceramics can exhibit is ferroelectricity. Ferroelectricity describes the property of a material to form electric dipoles without applying an electric field. Ferroelectricity only occurs in crystals that have a unit cell with no center of symmetry, i.e. non-centrosymmetric shape. [1,2,3,4,5]
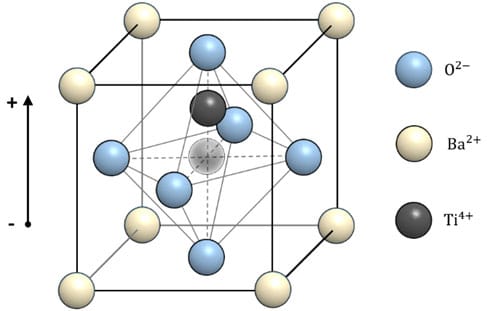
In a ferroelectric material, such as barium titanate, all direct and indirect neighboring cells form the aforementioned dipoles, which point in the same direction. Figure 1 depicts a simplified unit cell of the barium titanate unit cell with a permanent dipole. The alignment of neighboring dipoles is a result of total energy reduction due to dipole-dipole interactions. The ferroelectric attempts to attain a domain configuration that minimizes the total energy while satisfying both electrostatic and mechanical boundary conditions. [6] In an idealized system, all the dipoles in the crystalline material would collectively point in one direction. Real materials, however, always have minor imperfections that cause the collective orientation of the dipoles to be limited to areas called domains. The size of the domains, crystal configurations at domain boundaries and the orientation of the dipoles within the domains influence the polarizability and, thus, the permittivity of the material. [7,8] This is why MLCCs produced from different raw materials will have different ferroelectric behavior. [1,9,10]

Above the Curie temperature, which is specific for each ferroelectric material, this collective alignment is destroyed. In this phase, the dipoles are randomly aligned and no longer show a domain structure. Under these conditions, the material has paraelectric properties.[11] Ferroelectric materials always show some degree of paraelectric behavior. Paraelectricity may also be induced by chemical additives, which introduce defective sites and consequently prevent the formation of domains.
Compared to other materials, ferroelectrics, such as barium titanate, have a high polarizability and thus, a high relative permittivity. Barium titanate-based MLCCs have the benefit of combining low losses with high capacitance and small structural shape. This property makes MLCCs one of the most important passive components for switching converter circuits and filter applications.[10]
The trade-off for the large capacitance in ferroelectric class 2 MLCCs is the above-mentioned voltage dependence that leads to a disadvantageous decrease of capacitance with increasing DC voltage. In the further course of this article, we will first explain the polarization processes and second develop a model, designed to describe the voltage-dependent capacitance.
II. Experimental Details
Before the measurements, all capacitors (885012209073) have been annealed for at least 1 h at 150°C. The subsequent cool-down time was 24 h. All measurements were performed at room temperature.
For the hysteresis and time-dependent measurement, the LCR meter E4980A from Keysight was used in conjunction with the test fixture 16034G. The ac probing voltage amplitude of the LCR meter was 𝑉𝑟𝑚𝑠 = 1 𝑉 and the corresponding probing frequency was 1 kHz. The Automatic Level Control guarantees the fixed signal amplitude, which monitors the voltage level at the DUT and adapts the voltage level at the source.
III. Immediate polarization Effects on Capacitance-Voltage Measurements
Ferroelectric polarization is well studied and shall be reviewed briefly. [1,9,13] The polarization behavior of ferroelectric materials depends on the actual state of polarization, as shall be discussed with the capacitance-voltage and polarization-voltage graphs of a 10µF MLCC (X7R class 2), shown in Figure 2. The choice fell on this capacitor since it shows a pronounced dc-dependence, which is typical for this type.
During the measurement, a sinus probing waveform of frequency 𝑓 is applied to measure the capacitance of the capacitor. The ac probing waveform has a fixed amplitude throughout the measurement and induces a periodical change of voltage d𝑉. On the sinus signal, a dc voltage is superimposed, allowing the reorientation of the domain polarization. This reorientation takes place on a sub-second time scale and is thus an immediate polarization effect.
Branch 1 (dashed green):
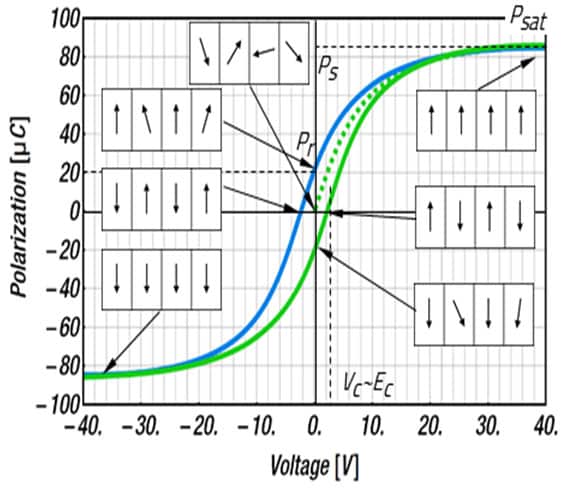
The capacitor, with randomly distributed domain polarizations, is subjected to the test signal. With the increase of dc voltage, the dipoles eventually become aligned, leading to increased polarization (Figure 2). The saturation polarization is reached, if all dipoles point in the direction of the external electric field (dc-voltage). As the voltage increases, the dipoles become aligned and the dipole movement becomes more restricted, which leads to a reduced change of charge d𝑞. Hence, the capacitance 𝐶 = 𝑑𝑞 / 𝑑𝑉 decreases with increasing dc voltage.
When the applied external field E, which is proportional to the applied voltage, has aligned the majority of the domains, the dipoles remain in this position even without the external field. The collective alignment creates an internal stabilizing coercive field, 𝐸𝑐. As the applied electric field increases, the overall polarization increases due to electronic, ionic and dipolar polarization effects.
The polarization at maximum voltage is referred to as saturation polarization 𝑃𝑠𝑎𝑡 . In principle, the spontaneous polarization 𝑃𝑠 is equal to the saturation polarization of the electric displacement extrapolated to zero field strength.

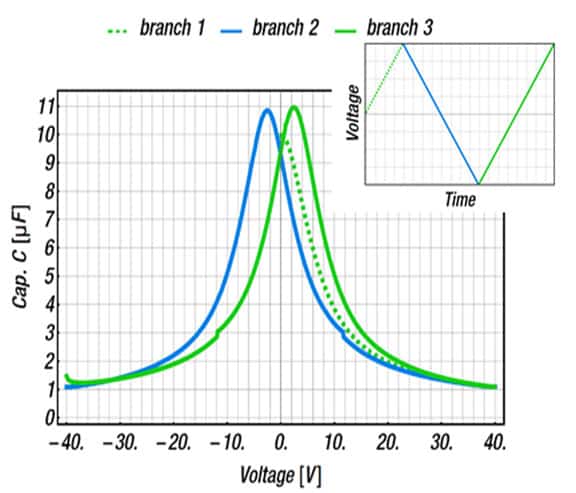

Branch 2 (blue):
As the voltage, and thus, the external field, is reversed from positive to negative, the dipoles relax slightly but remain in their overall polarization direction due to the internal coercive field, 𝐸𝑐. The polarization state at zero volts is referred to as remanent polarization 𝑃𝑟.
Any reversed external electric field will have to exceed 𝐸𝑐 in order to reorient all domains in the opposite direction. At the position of 𝐸𝑐 the strain on the dipoles is least. Thus, the permittivity of the material (susceptibility) is largest and the capacitance shows a local maximum. With the increase of polarization into the opposite direction, the capacitance decreases to the same value as for positive voltages.
Branch 3 (green):
If the voltage is driven from negative to positive, the dipoles reorient again when the externally applied field exceeds the coercive field. This, again, leads to a peak at the capacitance at positive voltages. The process is similar to the one described before. Branch 3 is similar to branch 2, except it is shifted along the x-axis toward positive voltages.
The above-described hysteresis requires the distinction between the polarizations for voltage sweeps from positive to negative and vice versa. Therefore, in the further course, 𝑃+(𝐸) denotes the polarization (branch 2) for voltage sweeps from positive to negative and 𝑃−(𝐸) (branch 3) the polarization for voltage weeps from negative to positive voltages.
Hence, any increase in dc voltage leads to a decrease in capacitance. However, the capacitance is further decreased with an increasing application time of dc voltage. That further decrease is related to the retarded movement of the domain walls, caused by domain wall pinning. [14,15,16,17,18] Domain wall motion takes place on a longer timescale than the initial reorientation of dipoles, which occurs on a sub-second timescale. [19] Domain wall movement generally leads to an additional gradual decrease of the capacitance of up to 20 %, which can take place over 1000 hours. [14,15]
Besides the domain wall movement, a field-induced phase transition may occur on some pristine barium titanate compounds [20,21]. During this process, the unit cell undergoes a structural change, forming the permanent dipole. This kind of phase transition causes a peak in the capacitance-voltage measurements even during the first sweep (Branch 1), which is similar to the one exhibited during the reorientation of the dipoles (in branch 2 and branch 3). Hence, the origin of the peak is not the reorientation of the dipoles but the reconfiguration of the unit cell in at least some fractions of the material. Such a behavior is not visible in this measurement shown here but may be in others.
The physics of ferroelectric and paraelectric materials are well discussed in scientific literature, which provides a solid basis for the development of a model suitable for technical applications such as electrical circuit simulation. [1,13,22,23]. The parameters are related to measurable and physically meaningful quantities such as remanent and spontaneous polarization.
A model that is based on an ideal polarization behavior [13] is:

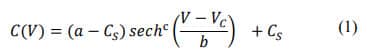
with 𝐶𝑆 as the quasi-linear contribution to the capacitance (voltage-independent pure capacitive part), 𝑉𝐶 as the coercive voltage (𝑉𝐶 ∝ 𝐸𝑐), 𝑎 as the factor proportional to saturation polarization, 𝑏 as the factor related to the width of the bell-shaped curve and c a slope form factor. The advantage of this model is that a, 𝑏, 𝐶𝑆 and 𝑉𝐶 can be retrieved directly from the measured data, i.e. no fitting is required. 𝐶𝑆 is the capacitance at the maximum voltage, (𝑎 − 𝐶𝑆) is the height of the peak (max. of 𝐶(𝑉)), 𝑉𝐶 is the position of the peak and 𝑏 can be calculated from 𝐶(𝑉) with the inverse of the hyperbolic secant.
Whether or not the polarization model published initially by Miller et al. [13] is based on first principles is of no importance at this point. What is relevant is the numerical simplicity, since the parameters can be clearly related to characteristic features of the measured data. Consequently, this leads to a situation where the set of parameters is relatively small and easily retrievable from the measurement.


Figure 3 shows a C-V measurement of a 10µF class 2 MLCC, which was measured with consecutive voltage sweeps, along with a fitted equation (1). Although the fit is not perfect, especially the features between -10 V and +10 V are well described by the model. The two visible peaks of the positive and negative branch occur, if the external field reaches the coercive field strength and cause a reversal of the dipole orientation. At this moment, the dipoles have large mobility, i.e. the change of charge is large. Thus, the capacitance has a local maximum at this position.[1]
IV. Aging Effects on Capacitance – Voltage Measurements
A long-term effect, also known as aging or second-stage process, will lead to a further decrease of capacitance over time. For many years, there has been a discussion in the literature about the exact origin of this long-term capacitance decrease. [24, 25, 26, 27, 28].
To mention two of several possible explanations: Some propose that the reduction of dielectric permittivity is due to the permittivity difference between two domains with orientations of 90° to each other.[15] It is argued that with time the domains with 90° polarization become orientated along the applied field. Since the domains with 90° polarization have higher polarizability than the ones parallel to the applied field, the overall permittivity is decreased as the 90° polarized domains are realigned.
Others propose that the effect is due to the diminished contribution of the domain wall region itself. [16] They argue that domain wall regions have comparatively large polarizability/permittivity and that the diminishing of the walls leads to a decrease in overall polarizability and, thus, the overall permittivity, i.e. capacitance decreases.
Both mentioned explanations are related to the retarded movement of the domain walls, caused by domain wall pinning. [14, 15, 16, 17]. This effect leads to a further gradual decrease of the capacitance upon applied dc voltages over a period of hours. Since domain wall movement is an essential process in several explanations, reviewing it in the following is worthwhile.
Figure 1 depicts a simplified unit cell that has a cubic structure. Due to structural stress within the lattice and/or applied electric fields, the unit cell can be stretched and tilted. This not only allows the displacement of the Ti-ion along this one vertical axis, as indicated in Figure 1, but also along other directions, leading to domains that have polarizations with an angle of 90° to each other, as is shown in Figure 4.[24] The boundaries between these domains, also known as 90° domain walls, are regions with higher polarizability than the domains themselves.[18].


Those domain walls stabilize their position at defect sites, i.e. defect dipoles. The continuous application of a dc field moves electrons to eliminate the defect dipoles with time. This enhances the domain-wall motion to align the 90° polarized domains of BaTiO3 to the electric field direction.
We want to refrain from discussing further proposed explanations of the long-term process. Researchers have not yet agreed on a unified explanation of the aging process. No matter what process is causing the capacitance decrease, more critical for the practical application is the actual magnitude and description of the effect. The long-term effect is exemplified at a 10 µF MLCC (PN: 885012209073) with a rated voltage of 50 V, in Figure 5. The capacitance-time graphs are measured at 100%, 80% and 50% of the capacitor’s rated voltage over a period of about 160 h. The measurement starts about 10 seconds after the application of the dc voltage. The graphs clearly show that the larger the dc voltage the larger the overall decrease of the capacitance. In this example, the saturation capacitance is reached in about 1 h or so. Other examples reach saturation after 10 h. [14,15] Beyond this time the capacitance remains almost constant or decreases at an even slower rate.


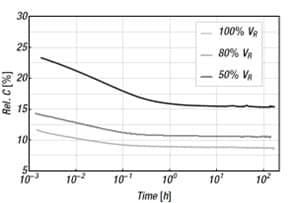
It is worthwhile to point out that the decrease relative to the rated voltage, due to the long-term process, is less pronounced than for the immediate process. The relative capacitance in Figure 6 shows that the capacitance values start already between 23% (50% of 𝑉𝑅) and 12% (100% of 𝑉𝑅). The long-term decrease in this example is about 3%, 4% and 8% for 100% of 𝑉𝑅, 80% of 𝑉𝑅 and 50% of 𝑉𝑅, respectively. This change is below the production tolerance of ±10%. The lower the dc voltage the larger the additional capacitance decrease.
Even at very small or no dc voltage, the MLCC will experience a slight capacitance decrease of about 10% to 20% (relative to rated capacitance) over a time of about 1000 h. [15,28,29] This is typical behavior for this capacitor technology, although slight variations between different products may occur, depending on the grain size or the chemical additives of the used ceramic material. [15,16,19] The capacitance decrease is voltage as well as temperature dependent. Consequently, from an experimental point of view, measuring all parameters over such a long period of time is laborious. However, a prudent and practical rule of thumb is to add another 10% capacitance decrease for voltages above 50% of 𝑉𝑅 and 20% capacitance decrease for dc voltages below 50% of 𝑉𝑅.
Some documentation or publication presents the relative change not in reference to but to the decreased capacitance value after the immediate process. This has the effect that the relative change due to the long-term process appears larger in numbers. Such representation may be justified in one case or another; however, it neglects the capacitance decrease due to the effects of the first immediate process. Therefore, such representations do not provide information about the overall capacitance decrease and may, therefore, not directly be used by the electrical engineer for the calculations of effective capacitances.
A model of the long-time effect on the capacitance, related to physically measurable parameters, is:


with 𝐶0 = 𝐶(𝑉) as capacitance at the beginning of the long-time process, 𝐶∞ as saturation capacitance (at the end of the long-time process), 𝜏 as a characteristic time as well as 𝛼 as form factor. [14, 26] The practicality of the model is exemplarily demonstrated in the measurements in Figure 5 with the parameters listed in Table 1.


V. Conclusion and Consequence for the Design – In Process
After introducing ferroelectricity, we have discussed the influence of immediate and long-term application of dc-bias voltage on capacitance measurements. The capacitance decrease due to the initial application is larger than for the subsequent long-term application. Although at lower voltages, the effect over the long-term becomes increasingly prominent. Thus, both effects have to be considered in the design-in process. It has been demonstrated mathematical models can well describe the effects. Since both models are related to physically meaningful parameters, they are well suited to be used in the design-in process to calculate the actual usable capacitance.
Consequently, for the circuit design, it is necessary to know the application-specific dc voltage load and operation time to make the right choice of MLCC. The best strategy is to anticipate the capacitance decrease and oversize in terms of rated voltage or capacitance accordingly. To do that, it is necessary to know the actual magnitude of the short as well as long-term capacitance decrease. For that, one may use educated approximations based on literature, actual measurements or models as implemented in the Würth Elektronik LTspice libraries. The mentioned LTspice models are based on actual measurements and specifically model the prominent short-term effect for each part.
To account for the long-time effect, it is most practical to add a further 10% capacitance decrease for voltages above 50% of 𝑉𝑅 and 20% capacitance decrease for dc voltages below 50% of 𝑉𝑅. The fact that this long-time process is also taking place at zero voltages is relevant for applications with long off-times. It would, however, not have any adverse effect on parts with long storage times in warehouses before the actual assembly and soldering, since the soldering temperatures are above the Curie temperature.
ACKNOWLEDGMENT
Special thanks to the technical experts Eric Fischer as well as Jon Izkue Rodriguez at Würth Elektronik, who provided measurements as well as technical support.
REFERENCES
[1] R. C. Buchanan (ed.), Ceramic Materials for Electronics, Third Edition, CRC Press Taylor & Francis Ltd (2018)
[2] M.J. Pan, A Brief Introduction to Ceramic Capacitors, DEIS Feature Article, IEEE Electrical Insulation Magazine, pp. 44-50 (2010)
[3] A. von Hippel, Ferroelectricity, Domain Structure, and Phase Transitions of Barium Titanate, Reviews of Modern Physics, 22, 221-237 (1950)
[4] Haertling, Ferroelectric Ceramics: History and Technology, Journal of American Ceramic Society, 82, 797-818 (1999)
[5] P. Popper, Ceramic Dielectrics and their Applications to Capacitors for Use in Electronic Equipment, Proceedings of the IEE – Part IIA: Insulating Materials, 100, 229-238 (1953)
[6] B. G. Potter Jr. et al, Monte Carlo simulation of ferroelectric domain structure: Electrostatic and elastic strain energy contributions, AIP Conference Proceedings 535, 173 (2000)
[7] K. Uchino, Ceramic Actuators: Principles and Applications, MRS Bulletin, 80, 42-48 (1993)
[8] G. Arlt et al., Domain configuration and equilibrium size of domains in BaTiO3 ceramics, 51, 4956-4960 (1980)
[9] W. Geng et al., Temperature dependence of ferroelectric property and leakage mechanism in Mn-doped Pb(Zr0.3 Ti0.7)O3 films, Ceramics International, 47:17, 24047-24052 (2021)
[10] K. Hong et al., Perspective and challenges in multilayer ceramic capacitors for next generation electronics, J. Mater. Chem. C, 7, 9782-9802 (2019)
[11] M. Peddigari et al., Linear and Nonlinear Dielectric Ceramics for High-Power Energy Storage Capacitor Applications, Journal of the Korean Ceramic Society 56:1 (2018)
[12] W.S. Ohm, Control of Electromechanical Properties of Multilayer Ceramic Capacitors for Vibration Reduction, Journal of the American Ceramic Society, 1001, 1982-1990 (2018)
[13] S.L. Miller et al., Modeling ferroelectric capacitor switching with asymmetric nonperiodic input signals and arbitrary initial conditions, Journal of Applied Physics, 70:2849-2860 (1991)
[14] T. Tsurumi et al., Mechanism of Capacitance Aging under DC Electric Fields in Multilayer Ceramic Capacitors with X7R Characteristics, Japanese Journal of Applied Physics, 44, 6989 (2005)
[15] T. Tsurumi et al., Mechanism of capacitance aging under DC-bias field in X7R-MLCCs. J Electroceram 21, 17–21 (2008)
[16] T. Teranishi et al., Domain contribution to the aging characteristics in BaTiO3 ceramics, Jpn. J. Appl. Phys., 58:SLLC03 (2019)
[17] J. Guyonnet, Ferroelectric Domain Walls – Statics, Dynamics, and Functionalities Revealed by Atomic Force Microscopy, Springer Cham, Springer Theses (2014)
[18] S. Wada et al., DomainWall Engineering in Barium Titanate Single Crystals for Enhanced Piezoelectric Properties, Ferroelectrics, 334, 17–27 (2006)
[19] Y. Li et al., Switching dynamics of ferroelectric HfO2 -ZrO2 with various ZrO2 contents, Appl. Phys. Lett. 114:14, 142902 (2019)
[20] J. E. Daniels et al., Electric-field-induced phase transformation at a lead-free morphotropic phase boundary: Case study in a 93 % ( Bi0.5 Na0.5 ) TiO3 – 7 % BaTiO3 piezoelectric ceramic, J. Appl. Phys. 95, 032904 (2009)
[21] T Iamsasri et al., Time and frequency-dependence of the electric field-induced phase transition in BaTiO3 -BiZn1/2 Ti1/2 O3, J. Appl. Phys. 122, 064104 (2017)
[22] K. M. Johnson, Variation of Dielectric Constant with Voltage in Ferroelectrics and Its Application to Parametric Devices, Journal of Applied Physics, 33:9, 2826-2831 (1962)
[23] Y. Zhang, Electric Field-Dependent Dielectric Properties and High Tunability of Porous Ba0.5 Sr0.5 TiO3 Ceramics, J. Am. Ceram. Soc., 90:4 1327–1330 (2007)
[24] A. Pramanick et al., Domains, Domain Walls and Defects in Perovskite Ferroelectric Oxides: A Review of Present Understanding and Recent Contributions, Critical Reviews in Solid State and Materials Sciences, 37:4, 243-275 (2012)
[25] Y. A. Genenko et al., Mechanisms of aging and fatigue in ferroelectrics, Materials Science and Engineering: B, 192, 52-82 (2015)
[26] T. Tybell et al., Domain Wall Creep in Epitaxial Ferroelectric Pb(Zr0.2Ti0.8)O3 Thin Films, Phys. Rev. Lett. 89, 097601 (2002)
[27] K.H. Härdtl, Electrical and Mechanical Losses in Ferroelectric Ceramics, Ceramics International, 8:4 (1982)
[28] K W Plessner, Ageing of the Dielectric Properties of Barium Titanate Ceramics, Proceedings of the Physical Society, Section B, 69:12, 1261-1268 (1956)
[29] S. Sato et al., A Study on Capacitance Aging in Ni-Electroded, BaTiO3-Based MLCCs with X7R Characteristics. Key Engineering Materials,157-158, 17–24 (1998